. 2010 Jul-Aug;51(4):361-73.
doi: 10.1111/j.1740-8261.2010.01681.x.

Normal canine brain maturation at magnetic resonance imaging

Affiliations

Normal canine brain maturation at magnetic resonance imaging

Bill Gross et al. Vet Radiol Ultrasound. 2010 Jul-Aug.

Abstract

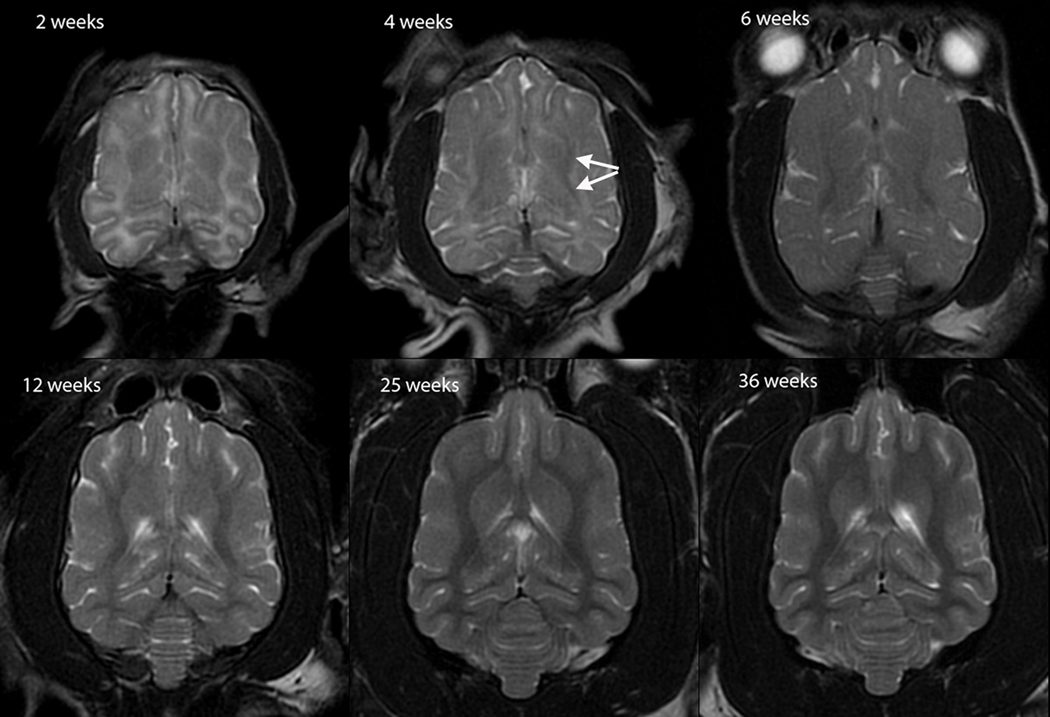
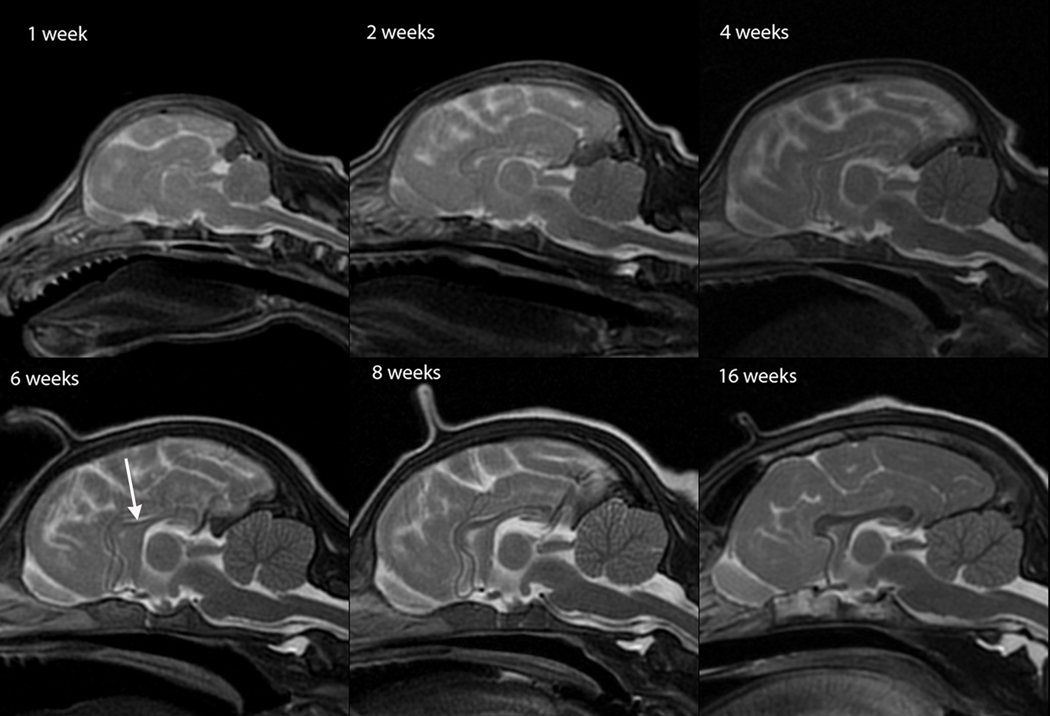
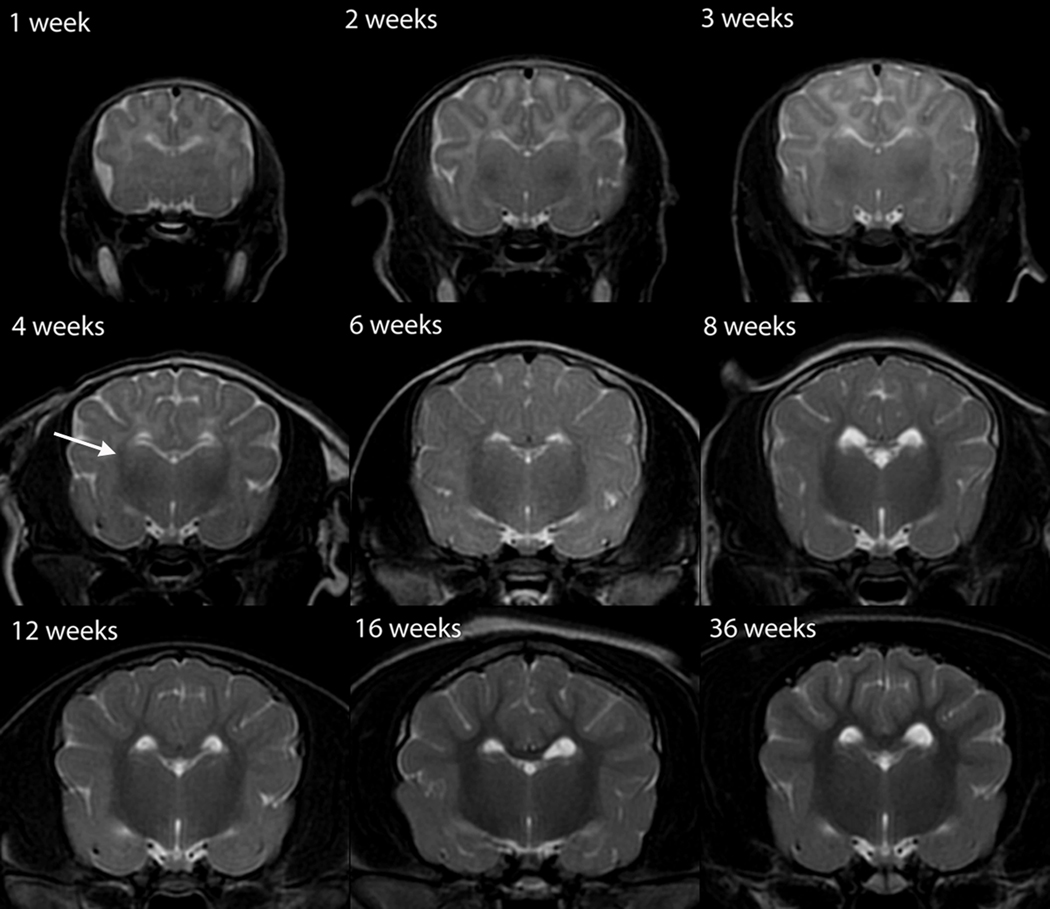
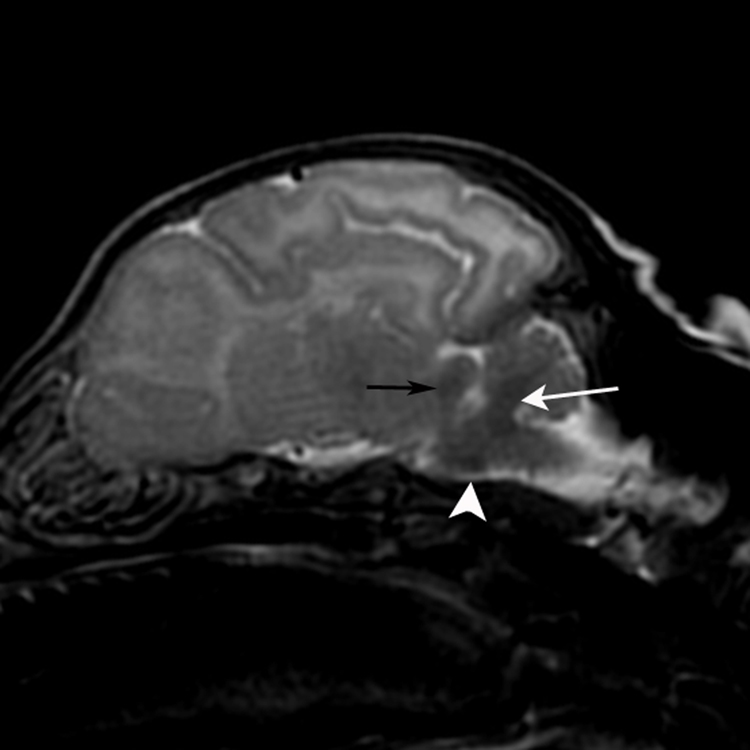
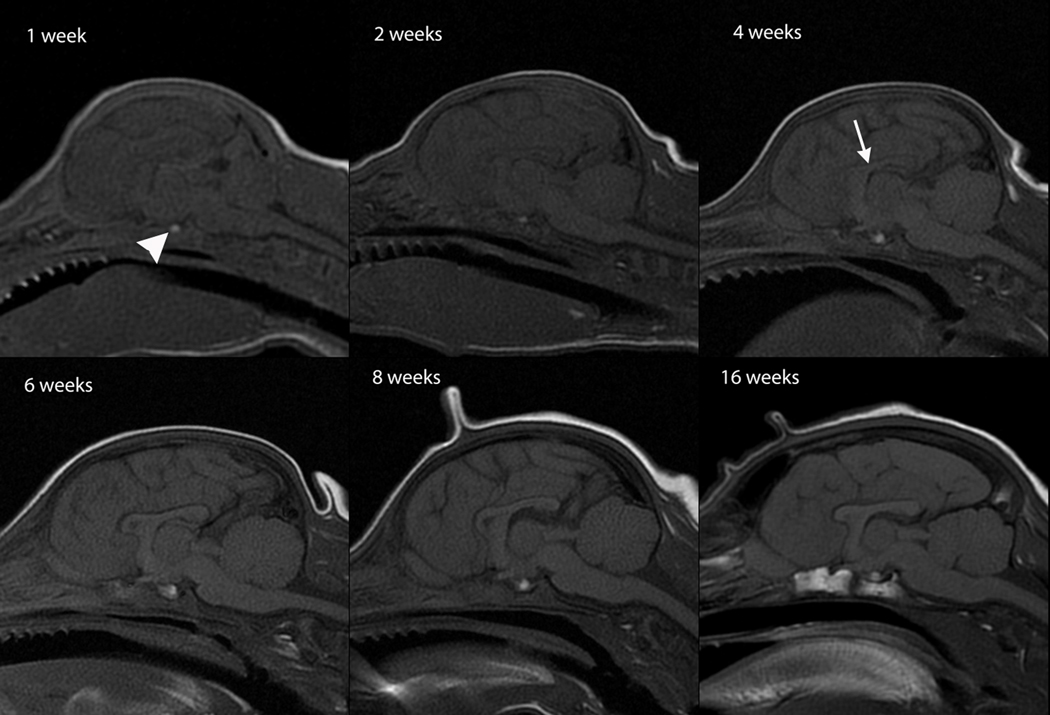
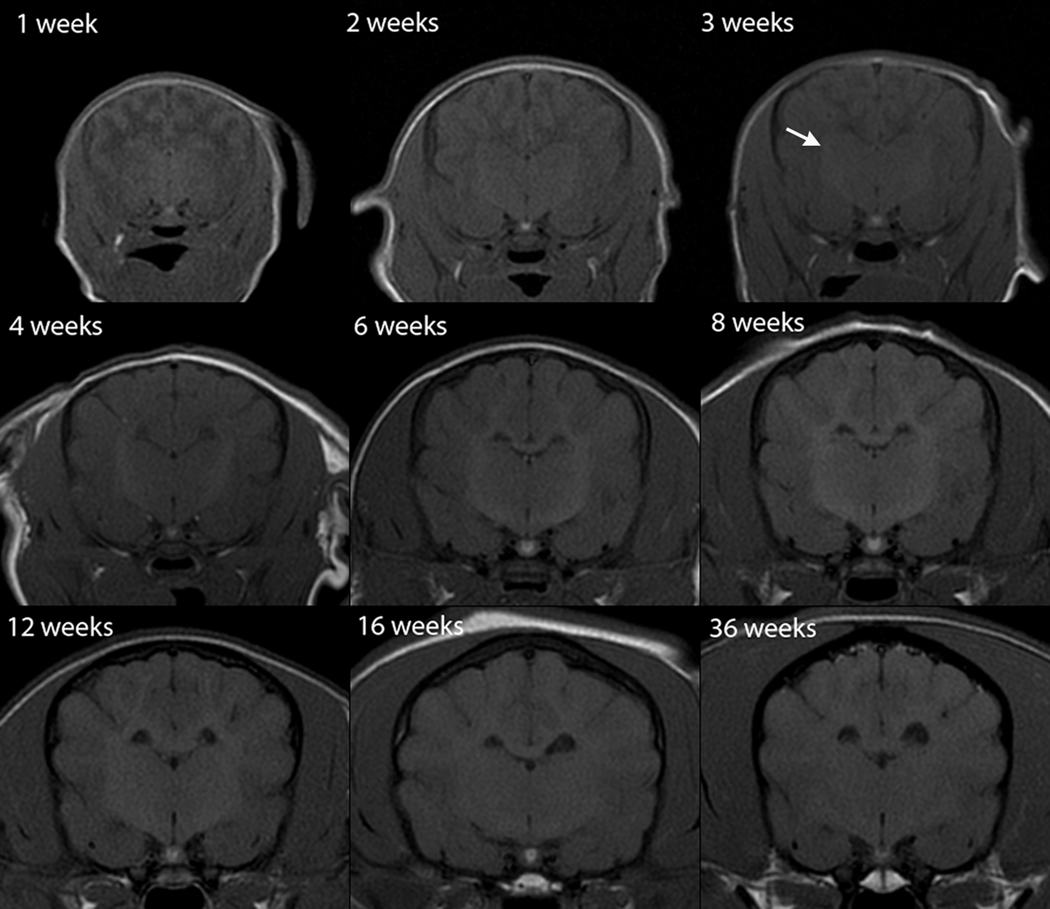
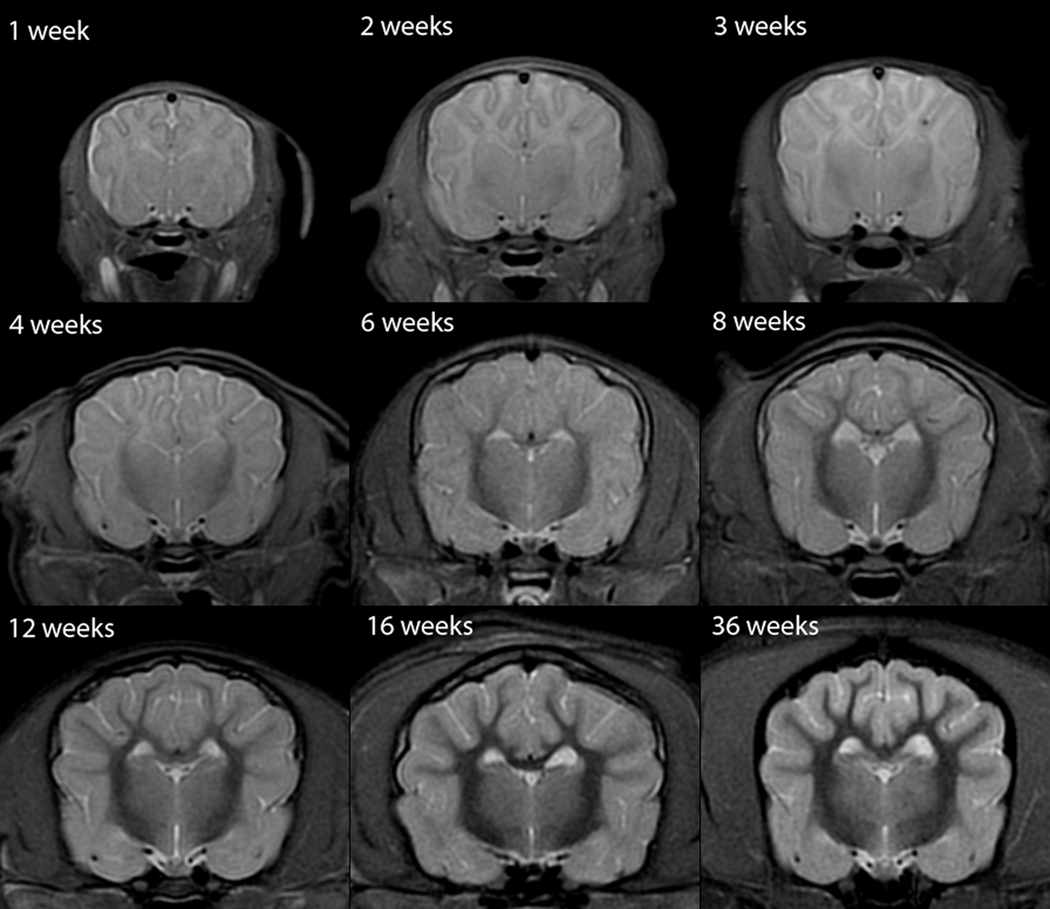
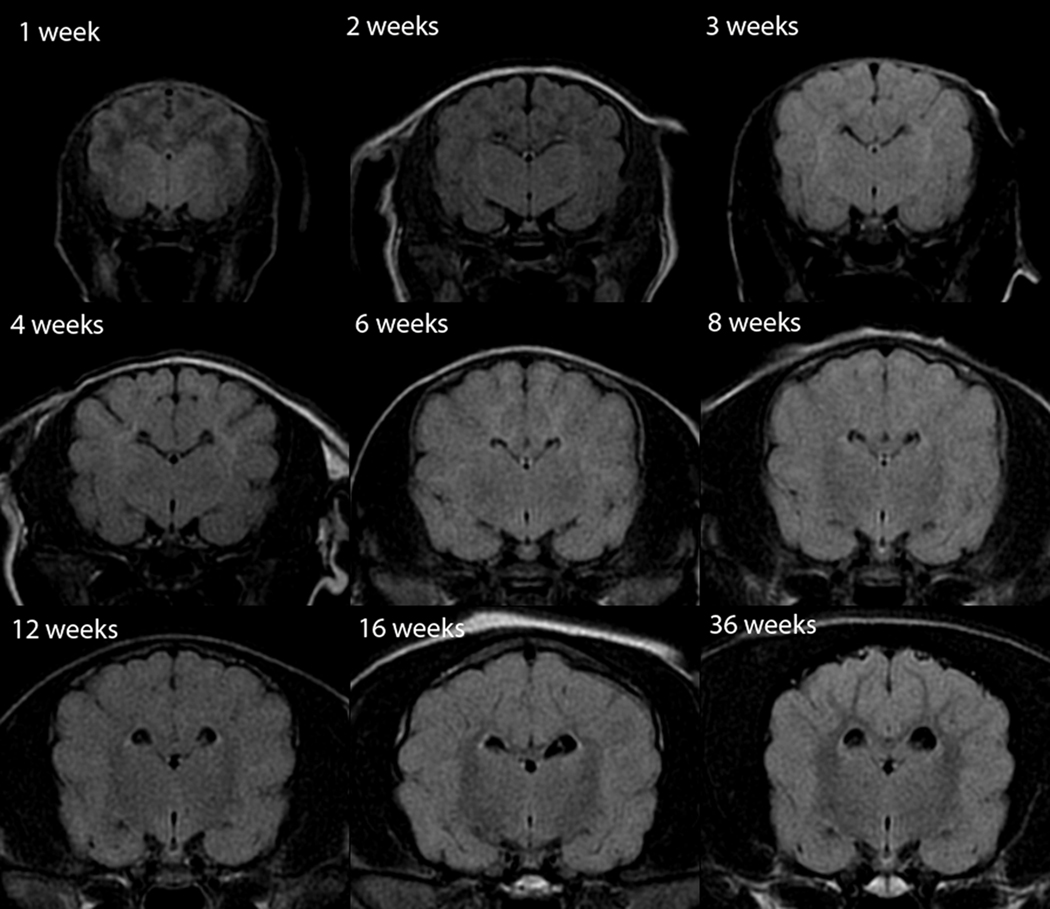
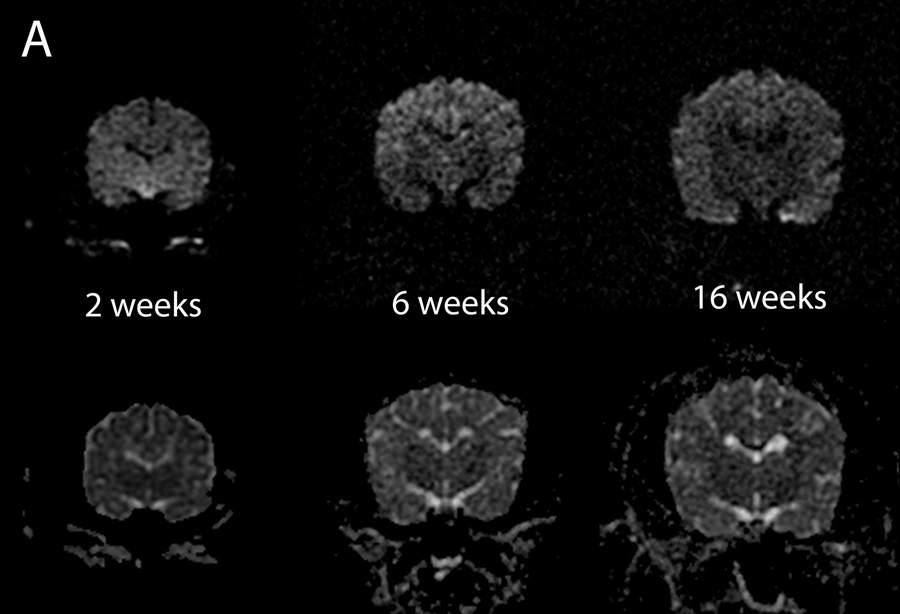
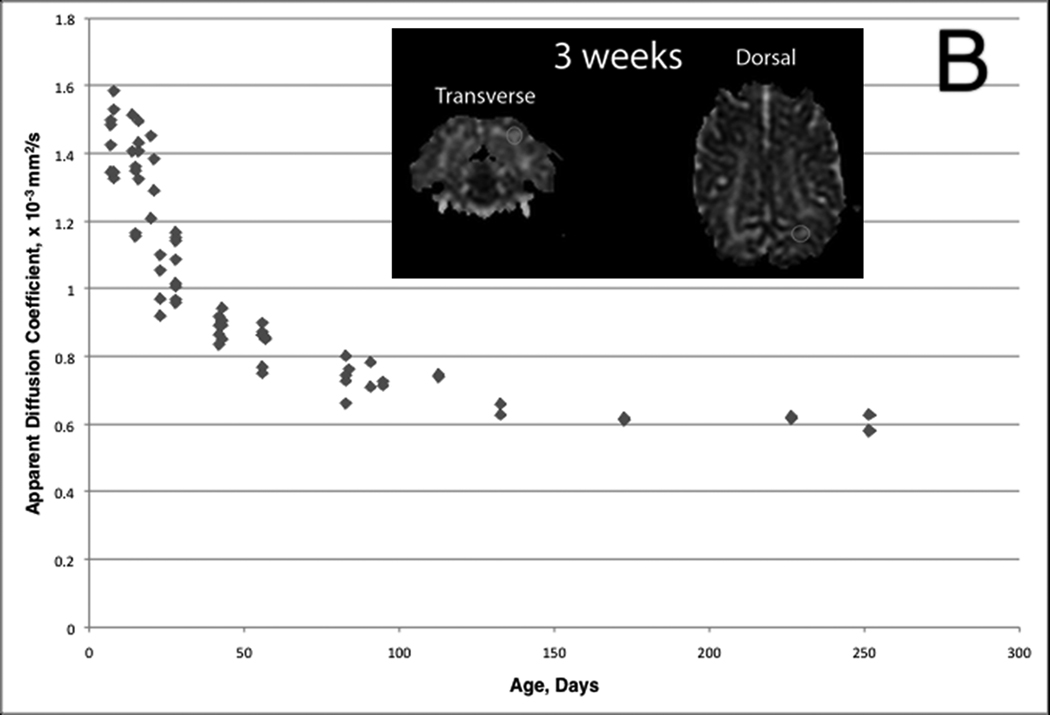
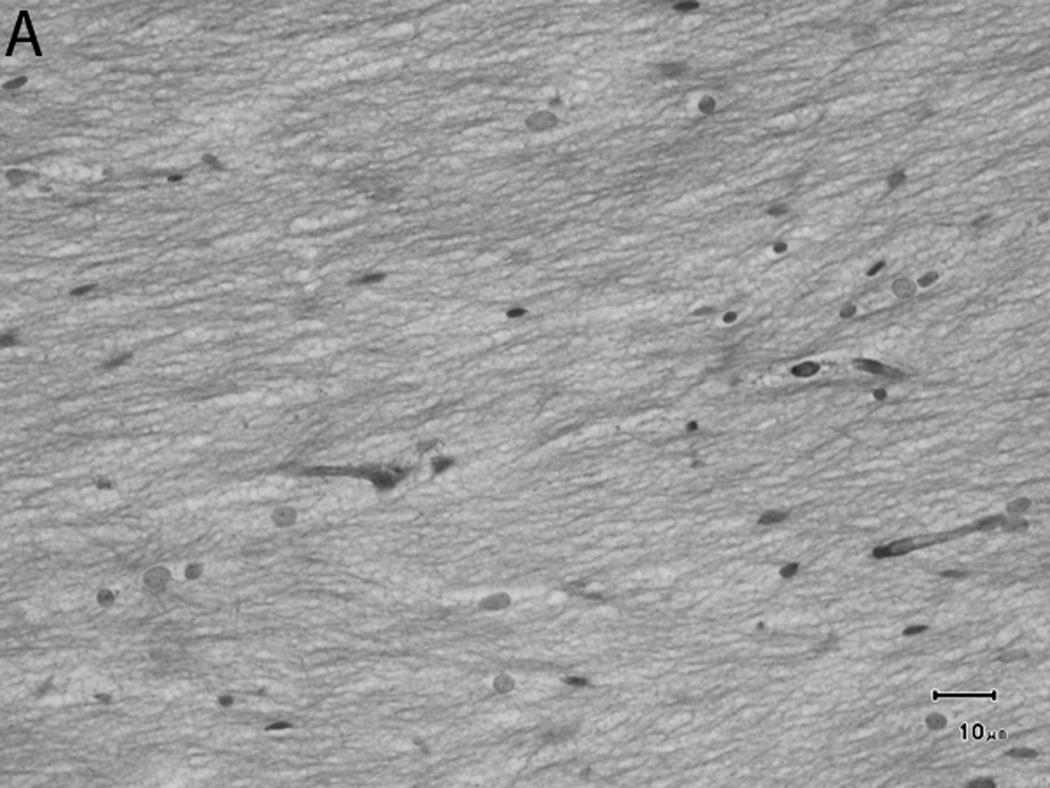
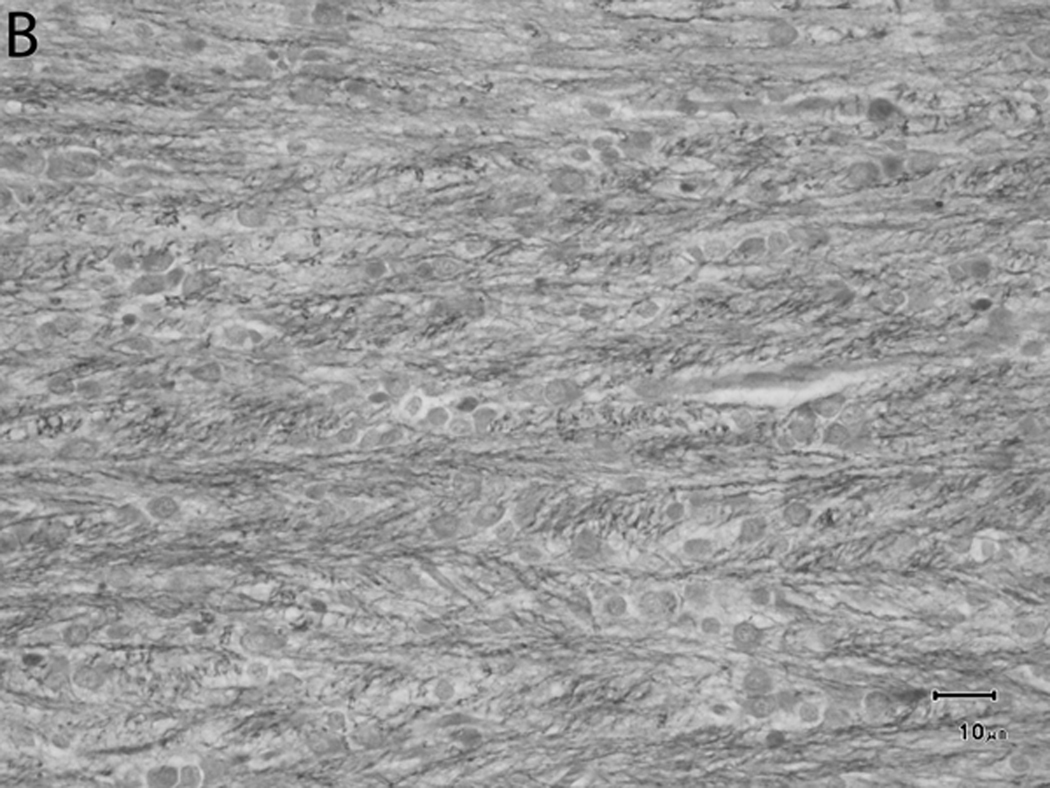
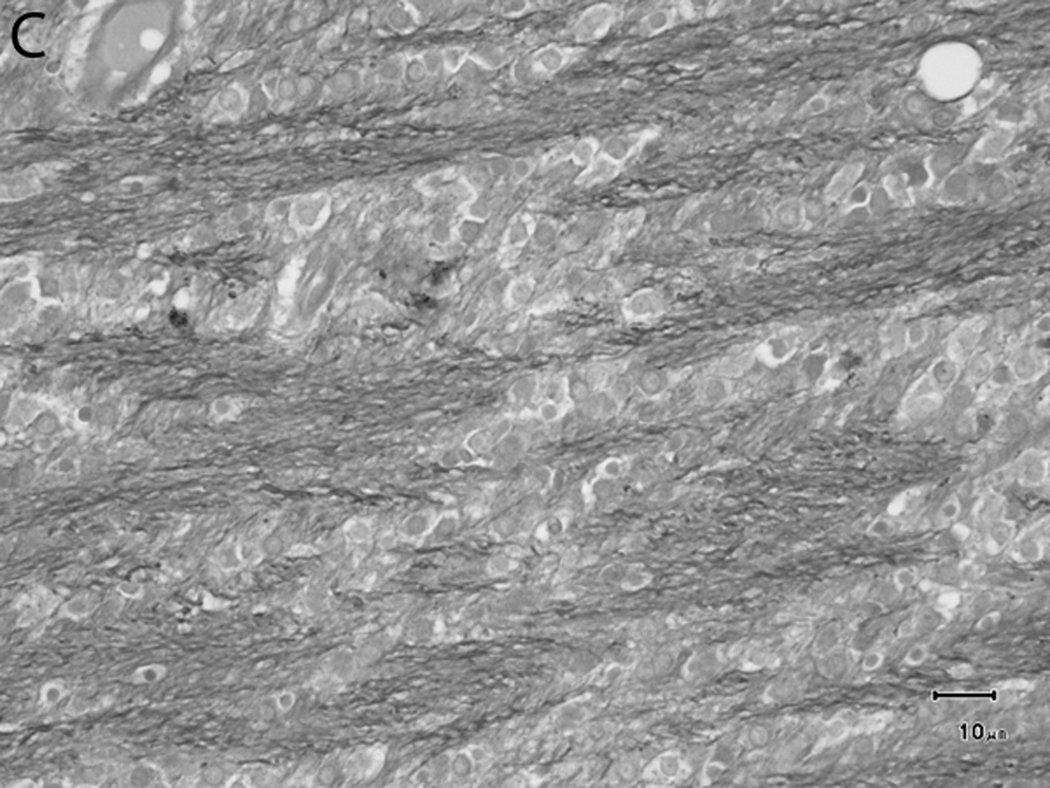
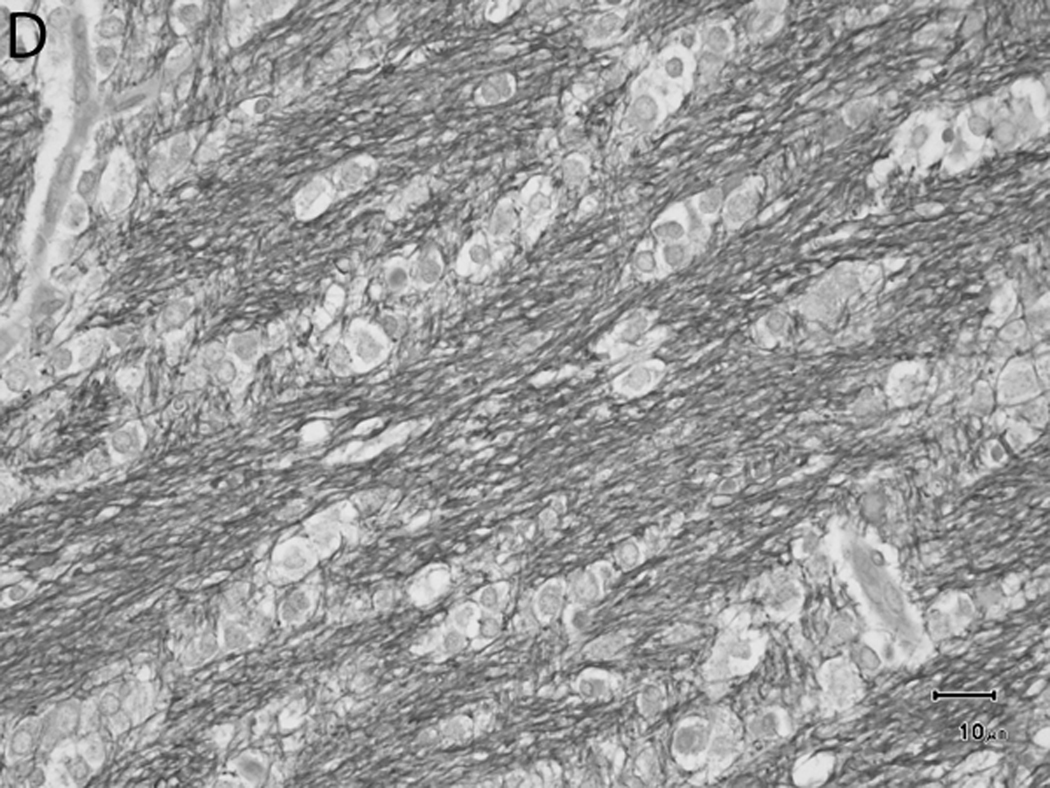
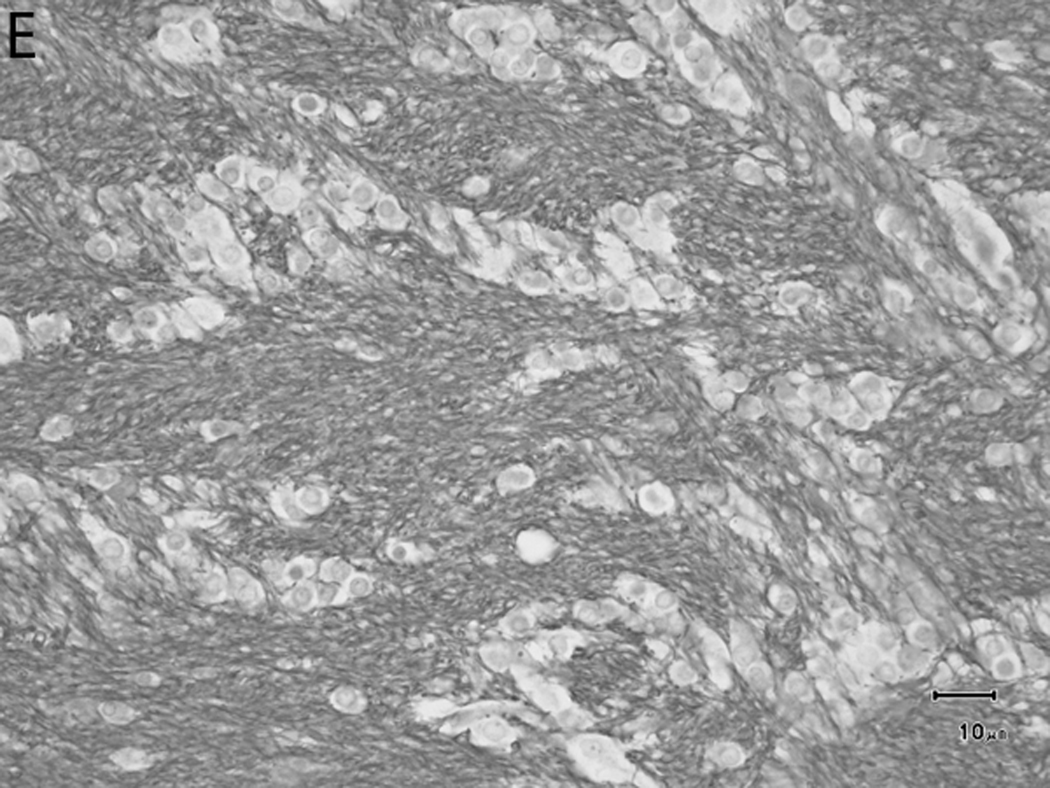
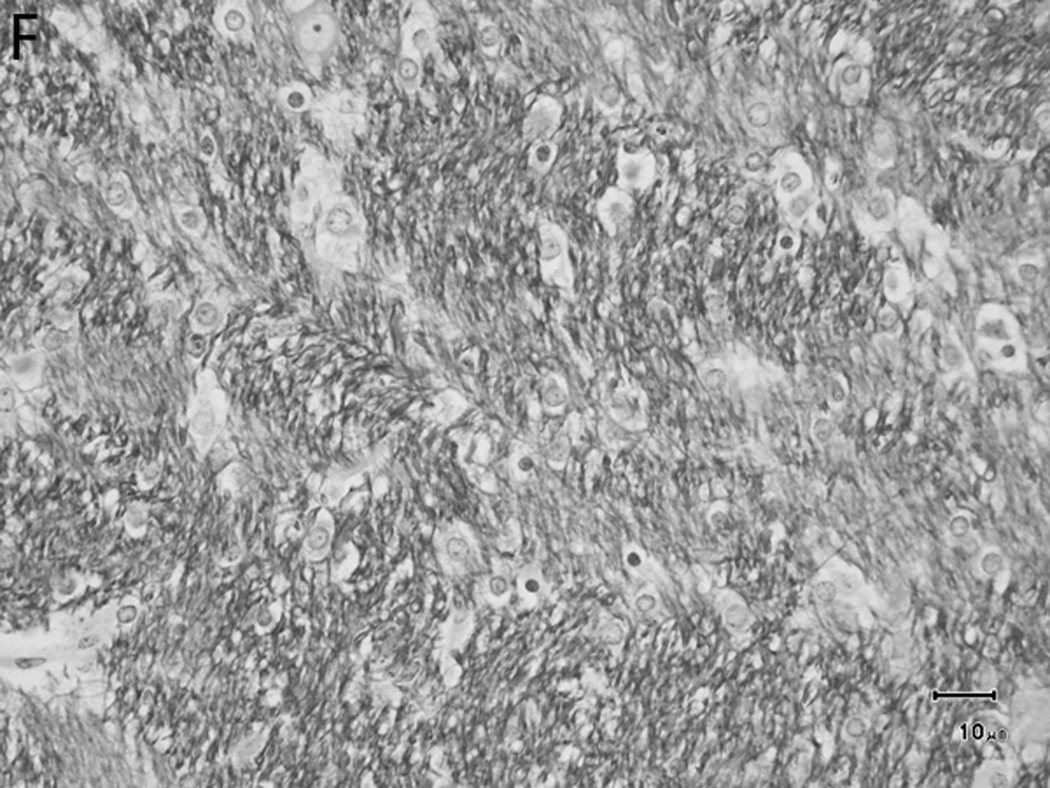
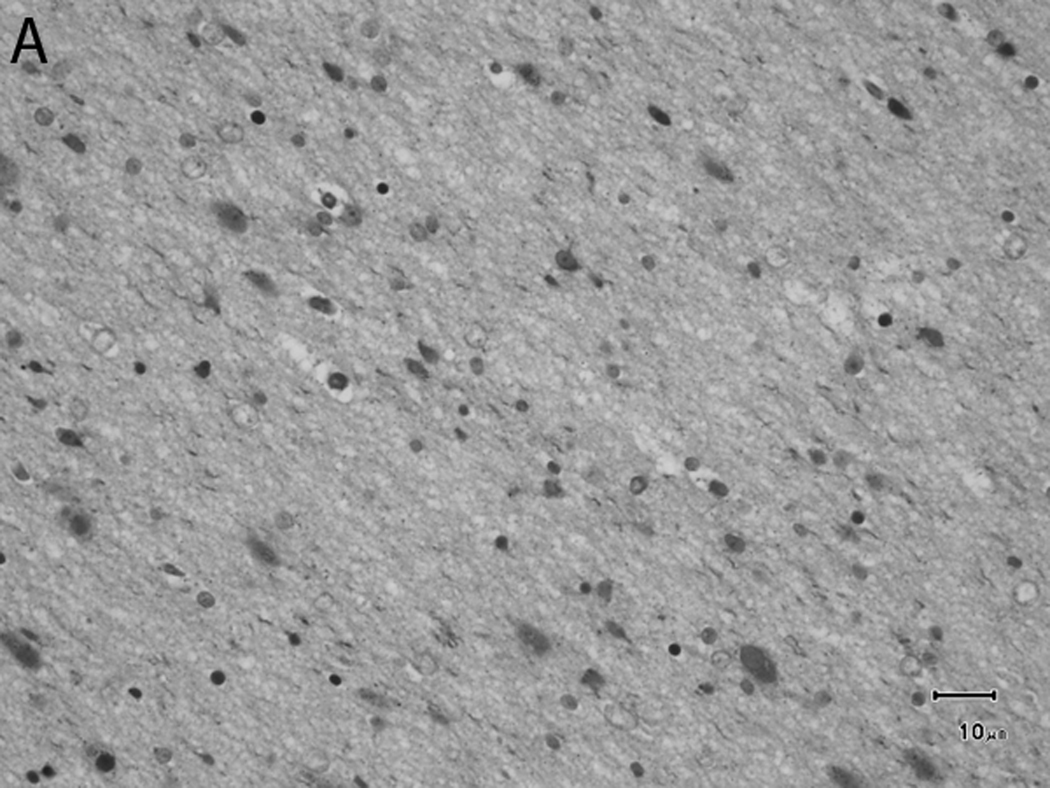
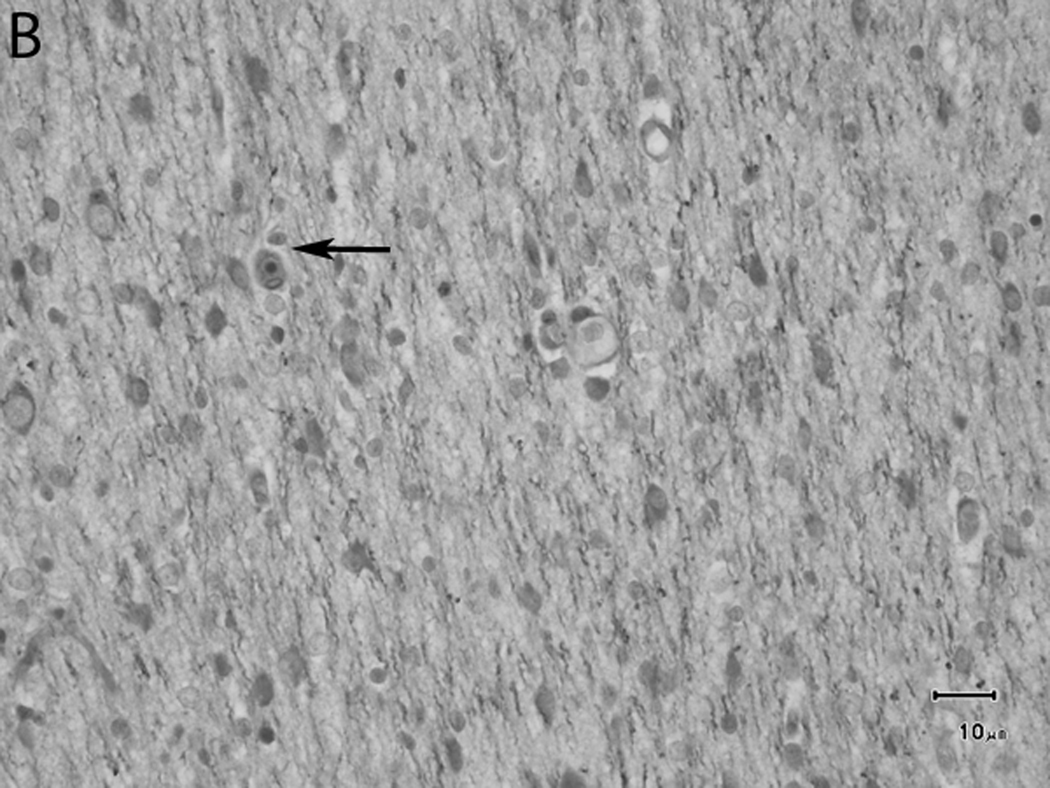
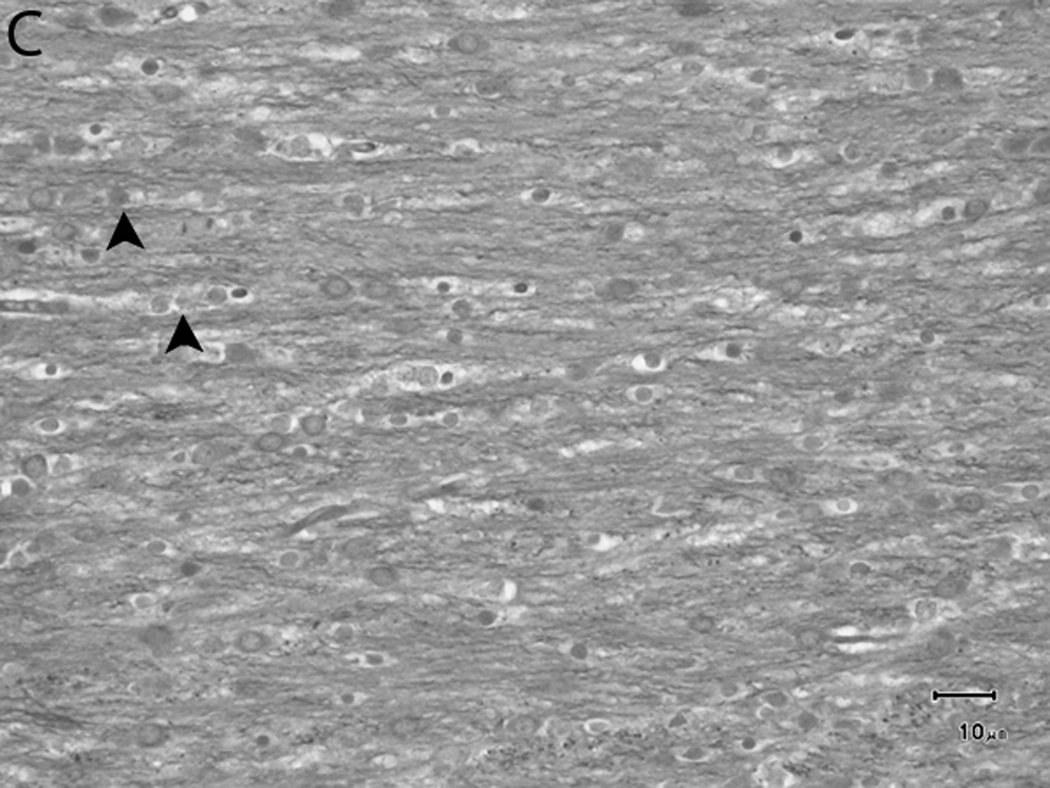
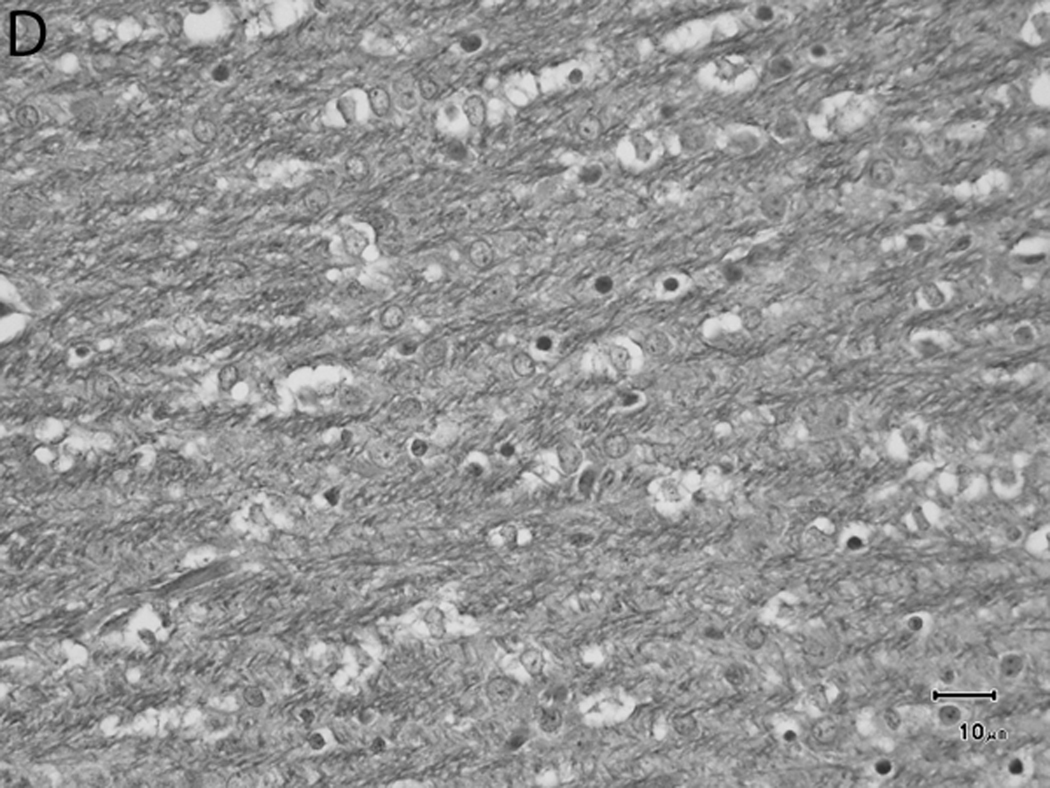
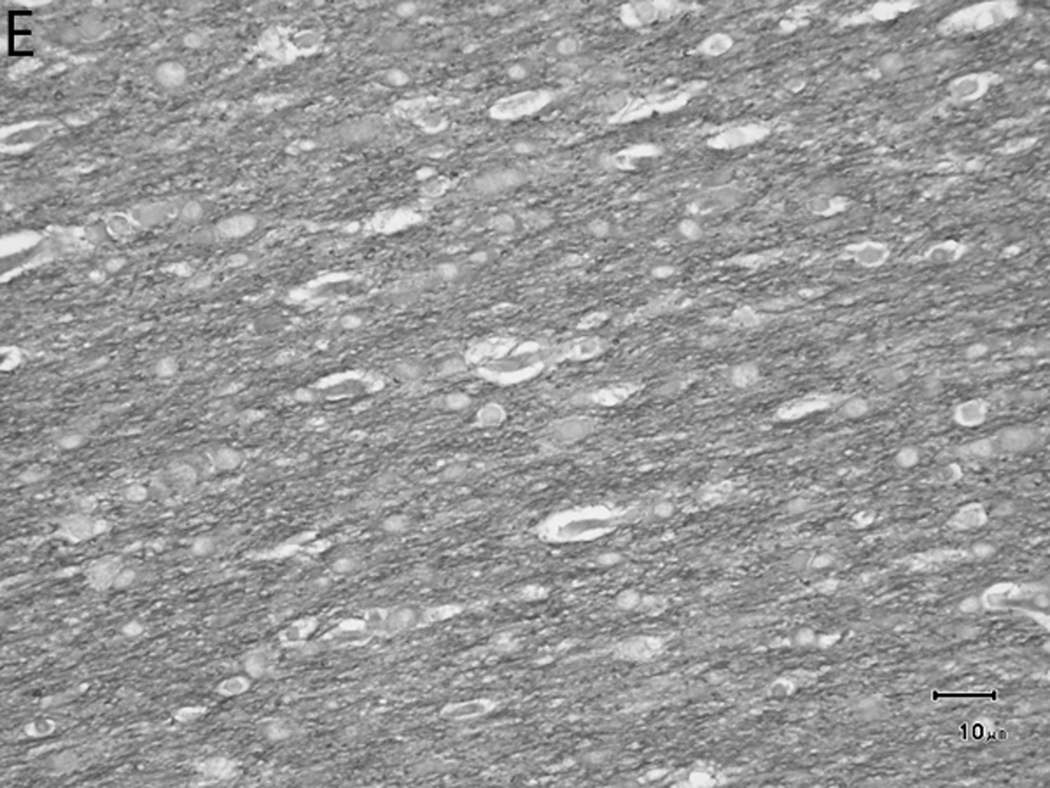
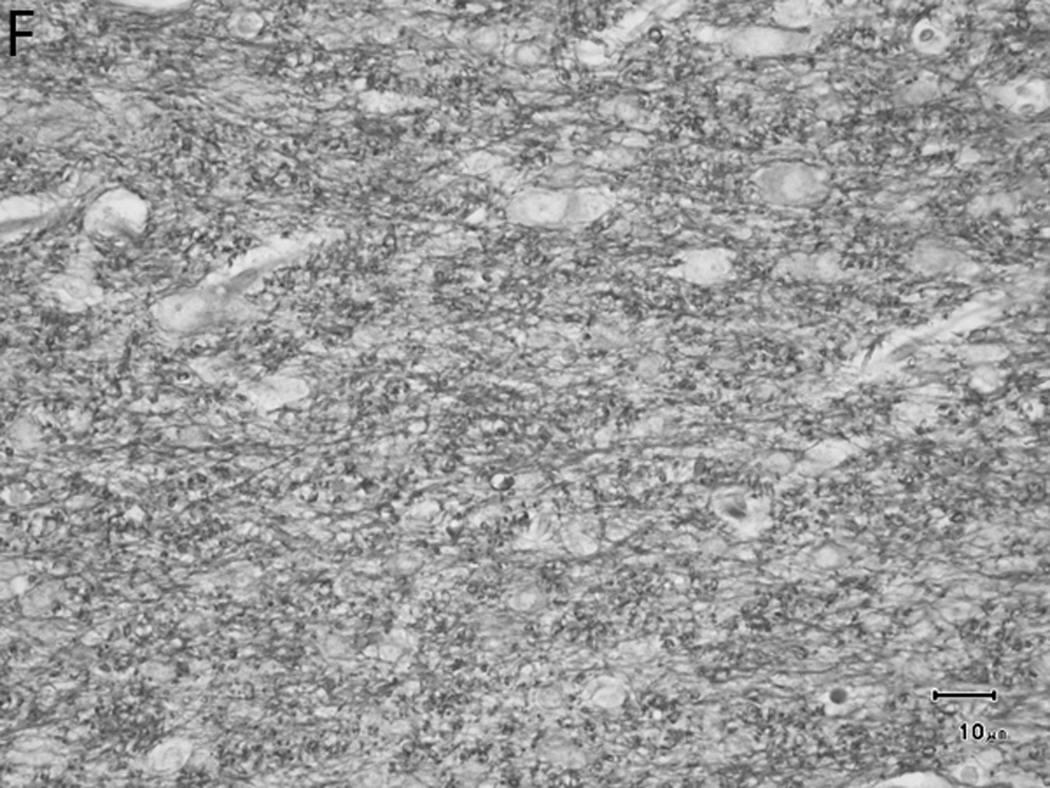
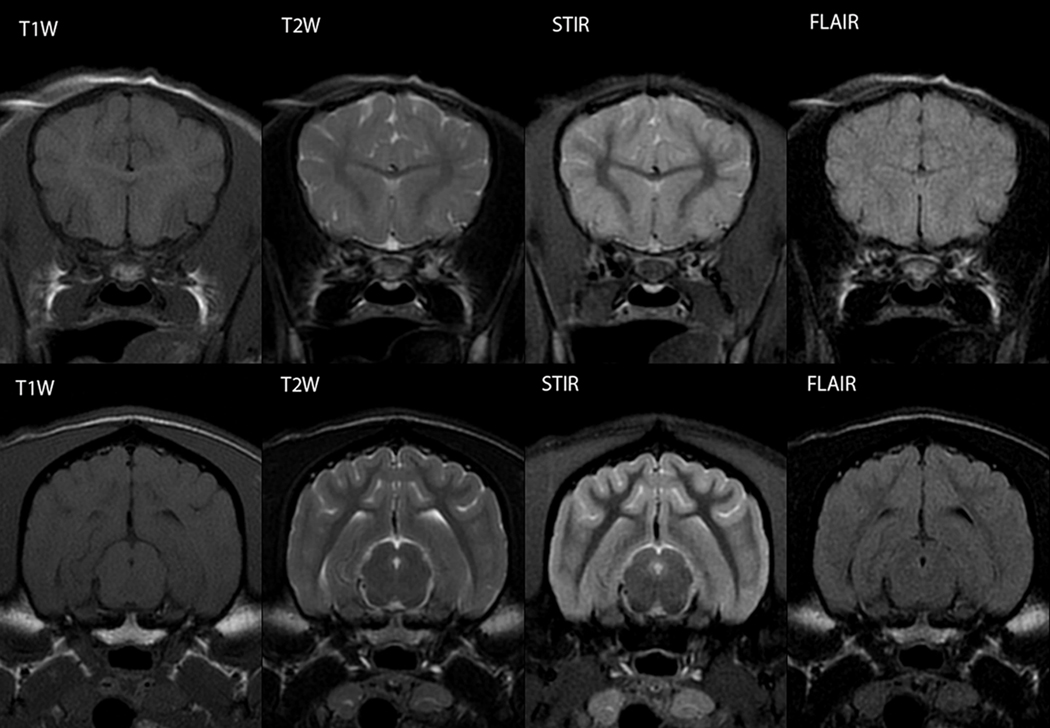
The normal neonatal canine brain exhibits marked differences from that of the mature brain. With development into adulthood, there is a decrease in relative water content and progressive myelination; these changes are observable with magnetic resonance imaging (MRI) and are characterized by a repeatable and predictable time course. We characterized these developmental changes on common MRI sequences and identified clinically useful milestones of transition. To accomplish this, 17 normal dogs underwent MRI of the brain at various times after birth from 1 to 36 weeks. Sequences acquired were T1-weighted (T1W), T2-weighted (T2W), fluid attenuated inversion recovery, short tau inversion recovery, and diffusion weighted imaging sequences. The images were assessed subjectively for gray and white matter relative signal intensity and results correlated with histologic findings. The development of the neonatal canine brain follows a pattern that qualitatively matches that observed in humans, and which can be characterized adequately on T1W and T2W images. At birth, the relative gray matter to white matter signal intensity of the cortex is reversed from that of the adult with an isointense transition at 3-4 weeks on T1W and 4-8 weeks on T2W images. This is followed by the expected mature gray matter to white matter relative intensity that undergoes continued development to a mostly adult appearance by 16 weeks. On the fluid attenuated inversion recovery sequence, the cortical gray and white matter exhibit an additional signal intensity reversal during the juvenile period that is due to the initial high relative water content at the subcortical white matter, with its marked T1 relaxation effect.


Figures

Fig. 1
Fig. 1
Dorsal T2-weighted canine brain maturation progression. Image location is through the cerebral cortex at the level of the dorsal internal capsule. The subcortical white matter is hyperintense to gray matter during the juvenile phase (2 weeks and 4 weeks), isointense during the transition phase (6 weeks) and exhibits hypointensity during the maturing phase and into adulthood (12–36 weeks). The relative decrease in white matter intensity is predominantly due to a decrease in water content during myelination. The internal capsule is first consistently identifiable at 4 weeks (arrows).
Fig. 2
Fig. 2
Sagittal T2-weighted canine brain maturation progression. Image location is midline. Hypointensity of the brainstem, relative to the cerebral gray matter, progresses from caudal to rostral during the first 6 weeks. At 6 weeks the brainstem and cerebellum exhibit an adult appearance. The relative decrease in white matter intensity is predominantly due to a decrease in water content during myelination. A hypointense linear feature corresponding with the corpus callosum becomes evident at 6 weeks (arrow). The full length of the corpus callosum is observed at 8 weeks and at 16 weeks it has an adult appearance.
Fig. 3
Fig. 3
Transverse T2-weighted canine brain maturation progression. Image location is mid telencephalon, at the level of the interthalamic adhesion. The subcortical white matter is hyperintense to gray matter during the juvenile phase (weeks 1–4), isointense during the transition phase (6 weeks) and exhibits a hypointensity during the maturing phase and into adulthood (8–36 weeks). The relative decrease in white matter intensity is predominantly due to a decrease in water content during myelination. The internal capsule is first consistently identifiable at 4 weeks (arrow), lateral to the geniculate bodies of the thalamus.
Fig. 4
Fig. 4
Parasagittal T2-weighted 3-week-old canine brain with early myelinating regions of the brainstem. The cerebellar peduncle (white arrow), trapezoid body (white arrowhead) and caudal colliculus (black arrow) exhibit prominent hypointensity at 2 and 3 weeks as a result of the relative decrease in water content that accompanies myelin formation and maturation.
Fig. 5
Fig. 5
Sagittal T1-weighted canine brain maturation progression. Image location is midline. A hyperintense linear feature corresponding with the corpus callosum is evident at 4 weeks (arrow). The relative increase in white matter intensity is due to a combination of increasing lipid and decreasing water during myelination. The full length of the corpus callosum is observed at 6 weeks and by 16 weeks it has an adult appearance. The normal neurohypophyseal focal hyperintensity, thought due to neurotransmitters, is evident at 1 week and beyond (arrowhead).
Fig. 6
Fig. 6
Transverse T1-weighted canine brain maturation progression. Image location is mid telencephalon, at the level of the interthalamic adhesion. The subcortical white matter is hypointense to gray matter during the juvenile phase (weeks 1–3), isointense during the transition phase (4 weeks) and exhibits hyperintensity during the maturing phase and into adulthood (6–36 weeks). The relative increase in white matter intensity is due to a combination of increasing lipid and decreasing water during myelination. The hyperintense internal capsule is first consistently identifiable at 3 weeks (arrow).
Fig. 7
Fig. 7
Transverse Short Tau Inversion Recovery (STIR) canine brain maturation progression. Image location is mid telencephalon, at the level of the interthalamic adhesion. The subcortical white matter is hyperintense to gray matter during the juvenile phase (weeks 1–4), isointense during the transition phase (6 weeks) and exhibits hypointensity during the maturing phase and into adulthood (8–36 weeks). The relative decrease in white matter intensity is due to a combination of decreasing water and increasing lipid during myelination. The subcortical white matter changes are similar to those of the T2-weighted sequence but with more pronounced relative white matter hypointensity during the mature phase.
Fig. 8
Fig. 8
Transverse Fluid Attenuated Inversion Recovery (FLAIR) canine brain maturation progression. Image location is mid telencephalon, at the level of the interthalamic adhesion. The telencephalon juvenile phase is characterized by two sub-phases, each with an associated transition phase; this differs from the maturation appearance in T1W and T2W images. The subcortical white matter is hypointense to gray matter at weeks 1 and 2 with a transition to being isointense at 3 weeks. This is followed by hyperintensity at weeks 4 and 6 with a second isointensity phase at 8 weeks. From 12 weeks and older the subcortical white matter is characterized by a progressive hypointensity during the maturing phase. The initial period of subcortical white matter hypointensity is attributed to the large amount of free water resulting in a T1 relaxation time similar to CSF, with resultant nulling of the signal by the inversion pulse. Following the rapid initial decrease in free water during the first three weeks, there is not enough free water to result in suppression and the signal intensity follows the T2 relaxation changes as the water content continues to decrease during myelination.
Fig. 9
Fig. 9
Diffusivity changes of the subcortical white matter in the developing normal canine brain. A) Diffusion Weighted Images (top row) and corresponding Apparent Diffusion Coefficient (ADC) maps (bottom row). The subcortical white matter is characterized by a progressive decrease in the ADC; evidenced by a decreasing brightness on the ADC maps. B) Mean ADC in a subcortical white matter ROI plotted as a function of time. Mean values are from a region-of-interest (ROI) placed at the subcortical left occipital lobe on dorsal and transverse images. The inset is an example of ROI size and location (white ovals). There is a rapid decrease in mean ADC during the first 4 weeks followed by a gradually declining rate of change through 36 weeks.
Fig. 9
Fig. 9
Diffusivity changes of the subcortical white matter in the developing normal canine brain. A) Diffusion Weighted Images (top row) and corresponding Apparent Diffusion Coefficient (ADC) maps (bottom row). The subcortical white matter is characterized by a progressive decrease in the ADC; evidenced by a decreasing brightness on the ADC maps. B) Mean ADC in a subcortical white matter ROI plotted as a function of time. Mean values are from a region-of-interest (ROI) placed at the subcortical left occipital lobe on dorsal and transverse images. The inset is an example of ROI size and location (white ovals). There is a rapid decrease in mean ADC during the first 4 weeks followed by a gradually declining rate of change through 36 weeks.
Fig. 10
Fig. 10
Sequential changes in myelination of the internal capsule. A) 1 week; there is pronounced interstitial water with minimal numbers of haphazardly organized oligodendrocyte-like cells. B) 2 weeks; there is a higher organization of rows or parallel cords of cells surrounding parallel myelinated fibers. C) 4 weeks; there is a marked reduction in the amount of interstitial fluid and a few intercrossing myelinated fibers. D) 6 weeks; there is an apparent reduction in the numbers of cells and thickening of the myelinated axons. E) 8 weeks; there is a dense appearance of the myelinated fibers and a reduction in size and number of the oligodendrocyte-like cells. F) 12 weeks; an increase in the density of the myelinated fibers is seen. Bars represent 10uM. Tissue is stained with Luxol Fast Blue stain.
Fig. 10
Fig. 10
Sequential changes in myelination of the internal capsule. A) 1 week; there is pronounced interstitial water with minimal numbers of haphazardly organized oligodendrocyte-like cells. B) 2 weeks; there is a higher organization of rows or parallel cords of cells surrounding parallel myelinated fibers. C) 4 weeks; there is a marked reduction in the amount of interstitial fluid and a few intercrossing myelinated fibers. D) 6 weeks; there is an apparent reduction in the numbers of cells and thickening of the myelinated axons. E) 8 weeks; there is a dense appearance of the myelinated fibers and a reduction in size and number of the oligodendrocyte-like cells. F) 12 weeks; an increase in the density of the myelinated fibers is seen. Bars represent 10uM. Tissue is stained with Luxol Fast Blue stain.
Fig. 11
Fig. 11
Sequential changes in the myelination of the subcortical white matter of the frontal lobe. A) 1 week; there is a large accumulation of interstitial fluid. B) 2 weeks, the amount of interstitial fluid is minimally reduced, the cells appear to start aligning in rows (arrow), and myelin accumulation is more apparent than in A. C) 4 weeks; less fluid is observed and cells with parallel arrangement are present (arrowheads). D) 6 weeks; moderate myelination is present, and interstitial fluid is still identified. E) 8 weeks; the myelinated fibers have a higher organization and the amount of fluid is minimal, giving a more dense appearance to the myelinated tissue. F) 12 weeks; the subcortical white matter appears denser and intercrossing fibers are present. Bars represent 10uM. Tissue is stained with Luxol Fast Blue stain.
Fig. 11
Fig. 11
Sequential changes in the myelination of the subcortical white matter of the frontal lobe. A) 1 week; there is a large accumulation of interstitial fluid. B) 2 weeks, the amount of interstitial fluid is minimally reduced, the cells appear to start aligning in rows (arrow), and myelin accumulation is more apparent than in A. C) 4 weeks; less fluid is observed and cells with parallel arrangement are present (arrowheads). D) 6 weeks; moderate myelination is present, and interstitial fluid is still identified. E) 8 weeks; the myelinated fibers have a higher organization and the amount of fluid is minimal, giving a more dense appearance to the myelinated tissue. F) 12 weeks; the subcortical white matter appears denser and intercrossing fibers are present. Bars represent 10uM. Tissue is stained with Luxol Fast Blue stain.
Figure 12
Figure 12
MRI sequence comparison of the immature and mature brain. Top row: transverse section through the rostral telencephalon at the level of the genu of the corpus callosum at 8 weeks of age. Bottom row: transverse section through the caudal telencephalon at the level of the mesencephalic aqueduct at 36 weeks of age. Each panel in the respective row is the same individual at the same scan date and same slice location for different MRI sequences, as labeled.

Similar articles

Cited by

References

    1. Fox MW. Integrative development of brain and behavior in the dog. Chicago and London: The Univerisity of Chicago Press; 1971.
    1. Baratti C, Barnett AS, Pierpaoli C. Comparitive MR imaging study of brain maturation in kittens with T1, T2, and the trace of the diffusion tensor. Radiology. 1999;210:133–142. - PubMed
    1. Barkovich AJ, Kjos BO, Jackson DE, Jr, Norman D. Normal maturation of the neonatal and infant brain: MR imaging at 1.5 T. Radiology. 1988;166:173–180. - PubMed
    1. Miot-Noirault E, Barantin L, Akoka S, Le Pape A. T2 relaxation time as a marker of brain myelination: experimental MR study in two neonatal animal models. J Neurosci Methods. 1997;72:5–14. - PubMed
    1. Jacobson S. Sequence of Myelinization in the Brain of the Albino Rat. A. Cerebral Cortex, Thalamus and Related Structures. J Comp Neurol. 1963;121:5–29. - PubMed

Publication types

MeSH terms