. 2010 Sep 22;132(37):12811-3.
doi: 10.1021/ja104573b.

Decomposition of vibrational shifts of nitriles into electrostatic and hydrogen-bonding effects

Affiliations

Decomposition of vibrational shifts of nitriles into electrostatic and hydrogen-bonding effects

Aaron T Fafarman et al. J Am Chem Soc. .

Abstract

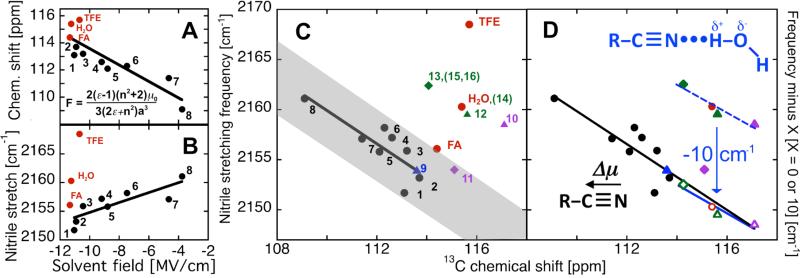
Infrared (IR) band shifts of isolated vibrational transitions can serve as quantitative and directional probes of local electrostatic fields, due to the vibrational Stark effect. However, departures from the Stark model can arise when the probe participates in specific, chemical interactions, such as direct hydrogen bonding. We present a method to identify and correct for these departures based on comparison of (13)C NMR chemical shifts and IR frequencies each calibrated in turn by a solvatochromic model. We demonstrate how the tandem use of these experimental observables can be applied to a thiocyanate-modified protein, ketosteroid isomerase, and show, by comparison to structural models, that changes in electrostatic field can be measured within the complex protein environment even in the background of direct hydrogen bonding to the probe.


Figures

Figure 1
Figure 1
Chemical shifts vs. nitrile stretching frequencies in simple solvents and in the enzyme KSI. (A) 13C-chemical shift values and (B) IR stretching frequency of the nitrile of 1% v/v EtSCN in different solvents (0.5% in cyclohexane) plotted against the solvent electric field calculated by the Onsager equation (inset Fig. 1A). Black circles for aprotic solvents (in order of decreasing dielectric, from left to right on x-axis, dielectric, ε, in parenthesis): 1. dimethylsulfoxide (46.7), 2. dimethylformamide (36.7), 3. acetone (20.7), 4. CD2Cl2(9.1), 5. tetrahydrofuran (7.6), 6. CDCl3 (4.8), 7. toluene (2.4), and 8. cyclohexane (2.0). Black lines indicate the best fits for the 13C NMR data: 108 ppm – 0.6 ppm/(MV/cm), R2 = 0.76; and for the IR data: 2163.5 cm-1 + 0.9 cm-1/(MV/cm), R2 = 0.69. Omitted from the fit of the IR data are the hydrogen bonding solvents formamide, water and trifluoroethanol (red circles); R2 increases by only 0.04 if protic solvents are omitted from fit of chemical shifts, whereas the correlation of vCNobs with solvent field for aprotic solvents is completely obscured if hydrogen-bonding solvents are included (R2 = 0.02). (C) 13C-NMR and IR from (A) and (B) plotted against each other in black and red circles, with line of best fit shown (-1.7 cm-1/ppm, R2 = 0.68) excluding H-bonding solvents (red circles). Observations for Cys-SCN-labeled KSI are numbered 9-16 (triangle for apo, diamond for liganded): apo M105C-CN (point 9), apo L61C-CN (point 10), L61C-CN•Equilenin (point 11), apo M116C-CN (point 12), M116C-CN•equilenin (point 13), M116C-CN•19-nortestosterone (point 14), M116C-CN•4-fluoro-3-methyl-phenol (point 15) and M116C-CN•2-naphthol (point16). Where points overlap (14 and H2O; 13, 15 and 16), only one example is plotted for clarity. (D) Same data as in (C) with and without IR correction for hydrogen bond contribution. All putative water-nitrile hydrogen bonded cases (all M116C-CN observations (12-16), apo L61C-CN (10), and EtSCN in water) shown before (closed symbols), and after (open symbols), subtraction by a 10 cm-1 correction for the hydrogen bond (blue line; slope = -1.4 cm-1/ppm, R2 = 0.93). The combined aprotic data and shifted data yield the trend shown by the dashed line (-1.7cm-1/ppm, R2 = 0.88). Protein spectra collected at 300 K in 40 mM phosphate buffer, pH 7.1. Frequencies are reported as the peak maximum; excluding TFE, EtSCN peaks are generally symmetric (see S.I.).

Similar articles

Cited by

References

    1. Park ES, Andrews SS, Hu RB, Boxer SG. J. Phys. Chem. B. 1999;103:9813–9817.
    1. Suydam I, Snow C, Pande V, Boxer S. Science. 2006;313:200–204. - PubMed
    1. Thielges M, Case D, Romesberg F. J. Am. Chem. Soc. 2008;130:6597–6603. - PMC - PubMed
    2. Ye S, Huber T, Vogel R, Sakmar TP. Nat. Chem. Biol. 2009;5:397–399. - PMC - PubMed
    1. Waegele MM, Gai F. J. Phys. Chem. Lett. 2010;1:781–786. - PMC - PubMed
    1. Sigala PA, Fafarman AT, Bogard PE, Boxer SG, Herschlag D. J. Am. Chem. Soc. 2007;129:12104–12105. - PMC - PubMed

Publication types