. 2010 Nov;78(3):686-700.
doi: 10.1111/j.1365-2958.2010.07355.x. Epub 2010 Sep 16.

Importance of the tmRNA system for cell survival when transcription is blocked by DNA-protein cross-links

Affiliations

Importance of the tmRNA system for cell survival when transcription is blocked by DNA-protein cross-links

H Kenny Kuo et al. Mol Microbiol. 2010 Nov.

Abstract

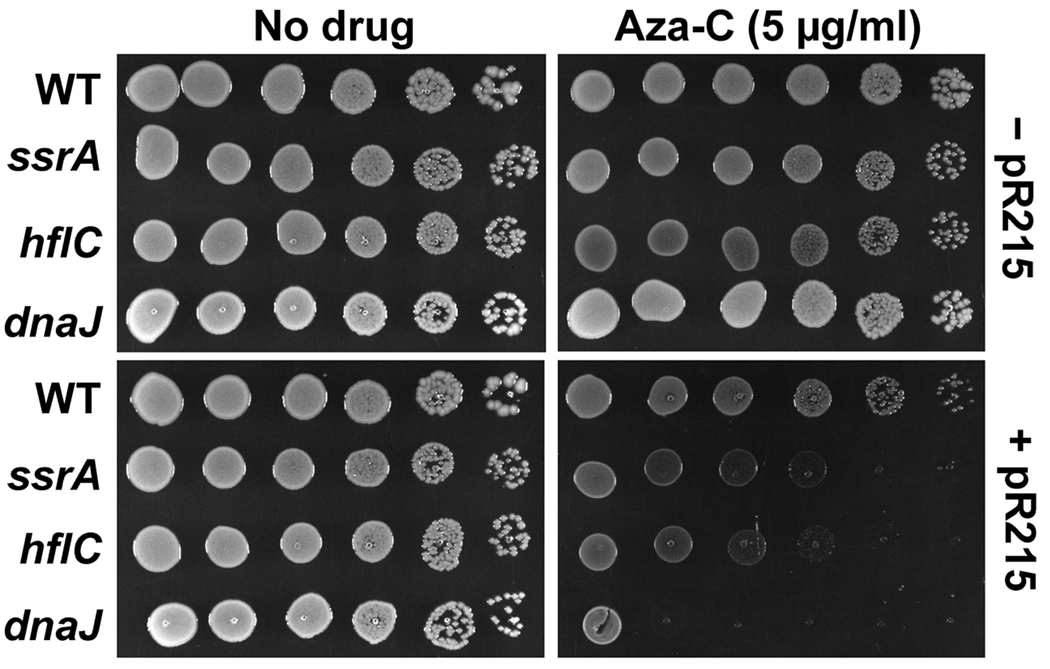
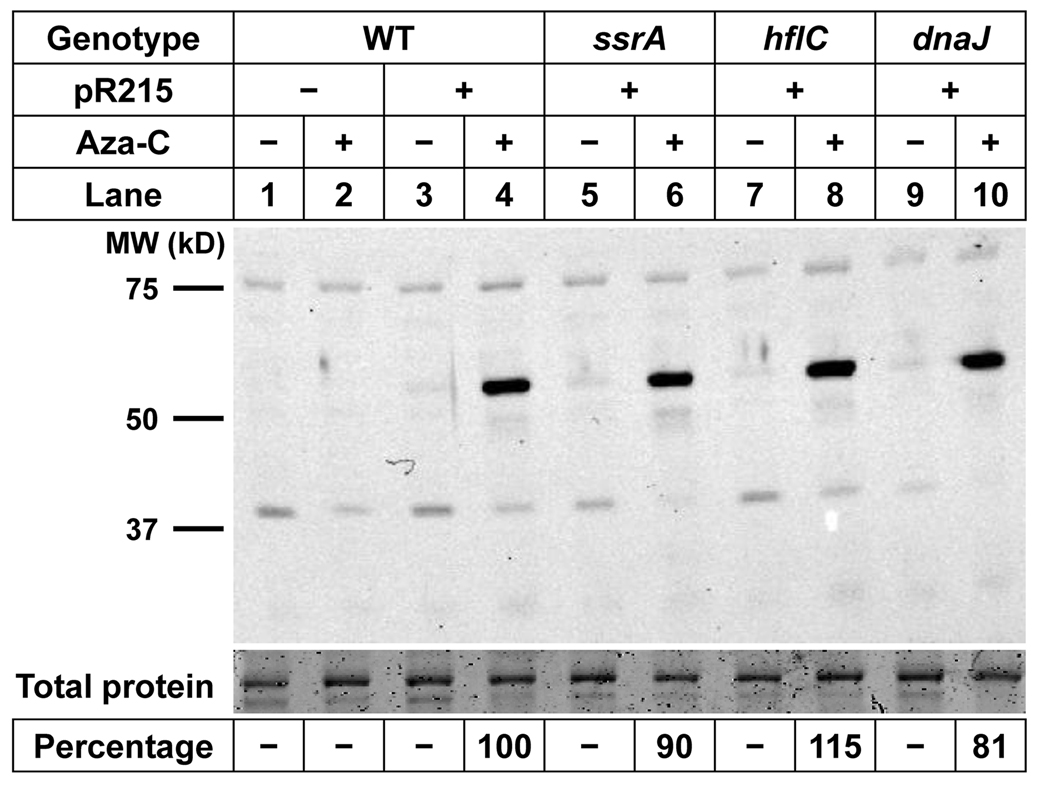
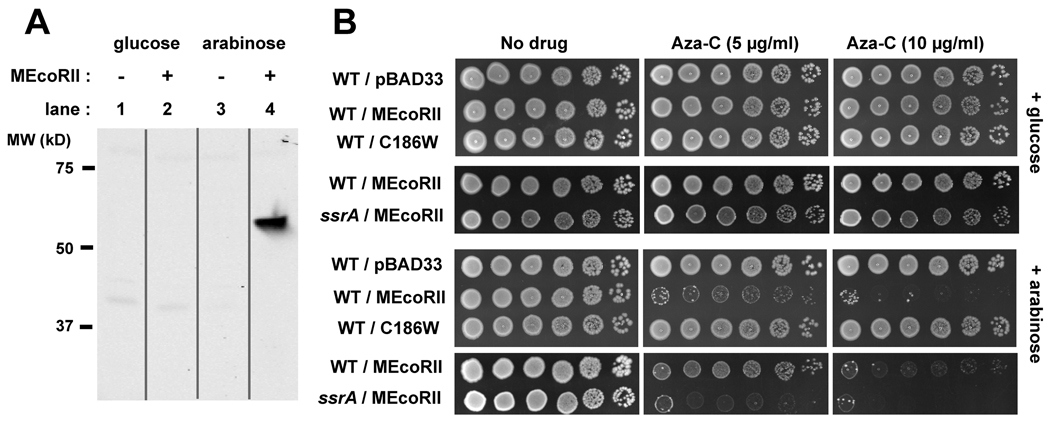
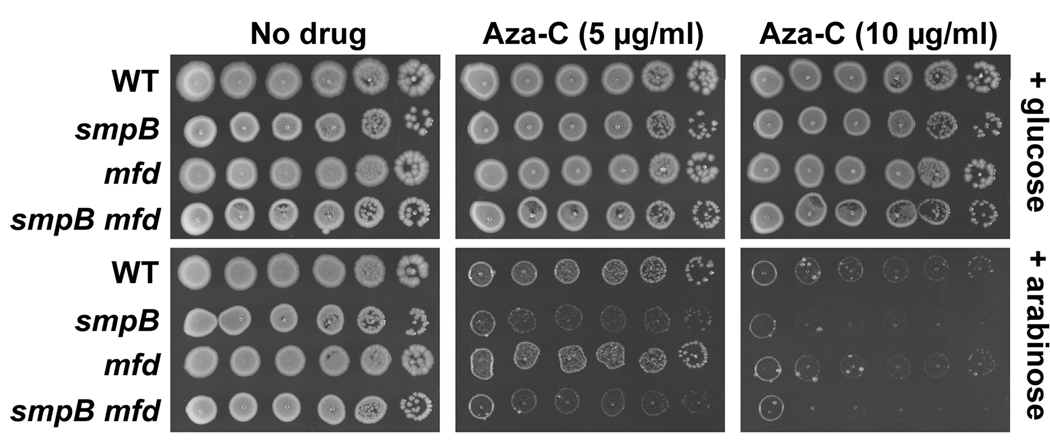
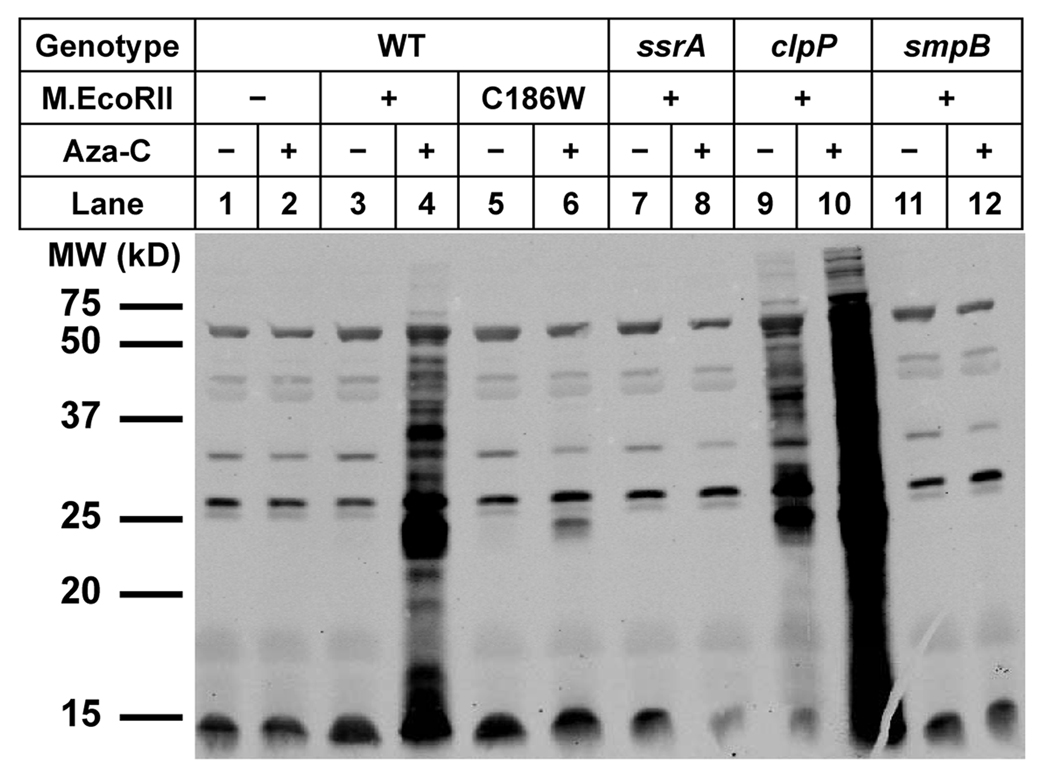
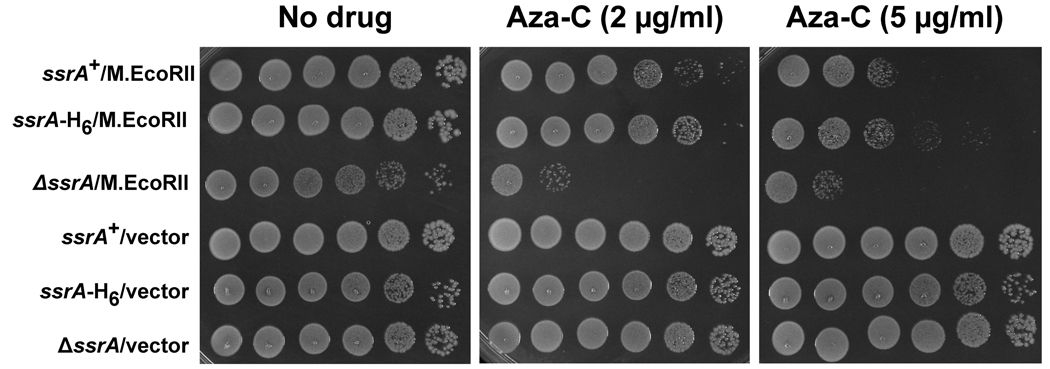
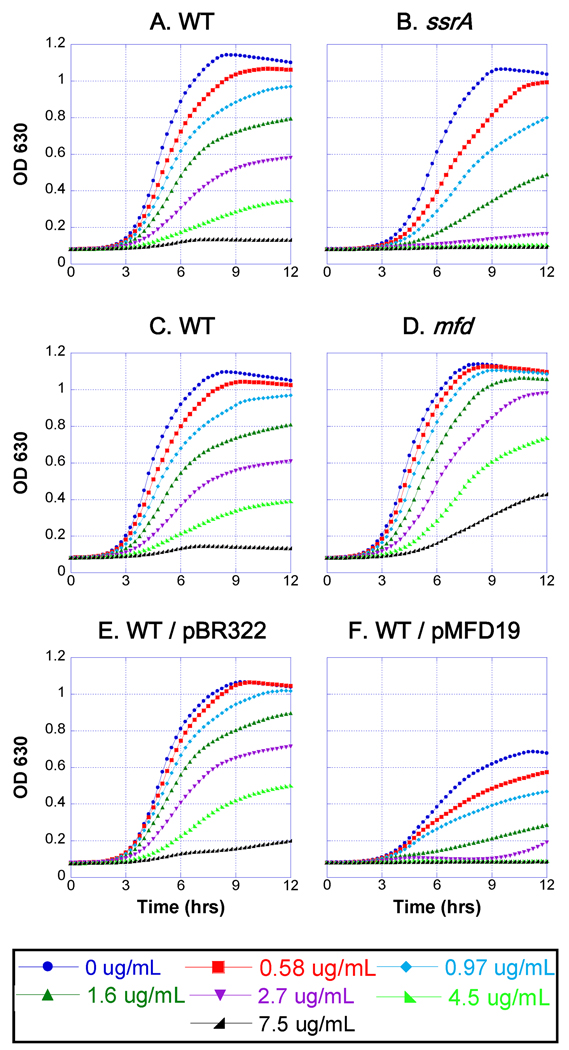
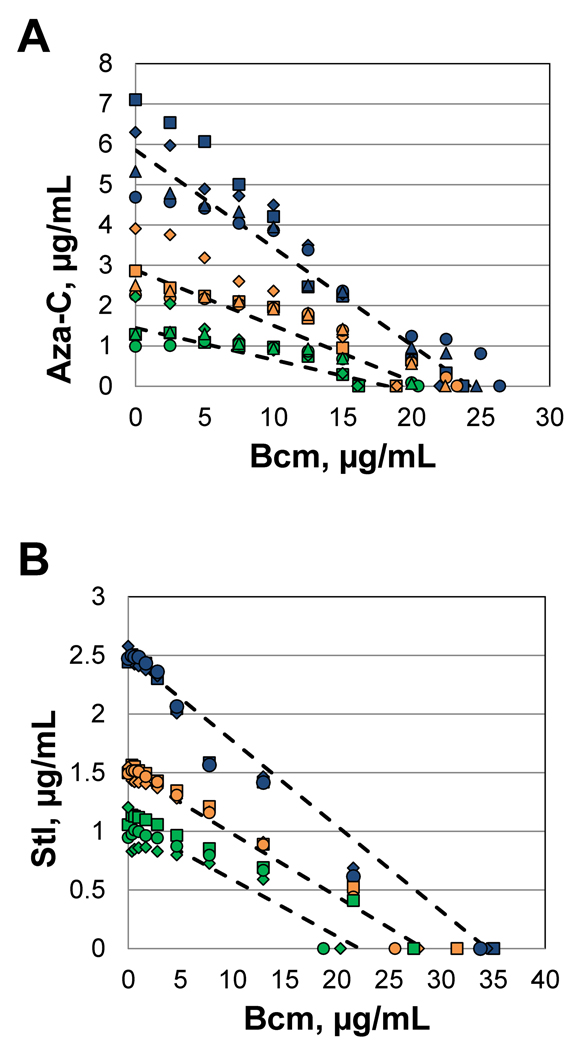
Anticancer drug 5-azacytidine (aza-C) induces DNA-protein cross-links (DPCs) between cytosine methyltransferase and DNA as the drug inhibits methylation. We found that mutants defective in the tmRNA translational quality control system are hypersensitive to aza-C. Hypersensitivity requires expression of active methyltransferase, indicating the importance of DPC formation. Furthermore, the tmRNA pathway is activated upon aza-C treatment in cells expressing methyltransferase, resulting in increased levels of SsrA tagged proteins. These results argue that the tmRNA pathway clears stalled ribosome-mRNA complexes generated after transcriptional blockage by aza-C-induced DPCs. In support, an ssrA mutant is also hypersensitive to streptolydigin, which blocks RNA polymerase elongation by a different mechanism. The tmRNA pathway is thought to act only on ribosomes containing a 3' RNA end near the A site, and the known pathway for releasing RNA 3' ends from a blocked polymerase involves Mfd helicase. However, an mfd knockout mutant is not hypersensitive to either aza-C-induced DPC formation or streptolydigin, indicating that Mfd is not involved. Transcription termination factor Rho is also likely not involved, because the Rho-specific inhibitor bicyclomycin failed to show synergism with either aza-C or streptolydigin. Based on these findings, we discuss models for how E. coli processes transcription/translation complexes blocked at DPCs.


Figures

Figure 1
Figure 1. Aza-C hypersensitivity of mutants with M.EcoRII expression vector
Overnight cultures of HK21 (WT) or the indicated HK21 derivatives, with (lower panels) or without (upper panels) M.EcoRII-expressing plasmid pR215, were diluted to 4 × 10⁸ cells/ml. Ten-fold serial dilutions were generated across a microtiter plate and 5 µl of each dilution was spotted onto LB plates with no drug (left panels) or aza-C (5 µg/ml; right panels). Plates were photographed after overnight incubation at 37°C.
Figure 2
Figure 2. Expression of M.EcoRII in wild-type and mutant cells
Extracts from HK21 (WT) or the indicated HK21 derivatives, with or without M.EcoRII plasmid pR215, were analyzed by Western blotting with polyclonal antibodies to M.EcoRII. The top portion of the gel was excised and stained with Coomassie blue as a total protein loading control. The Western antibody signals and total protein controls were quantitated using an Infrared Imaging System (see Experimental Procedures). The calculated ratio of M.EcoRII to total protein for the four lanes with significant M.EcoRII is expressed as percentage of wild-type levels at the bottom of the figure.
Figure 3
Figure 3. Arabinose-inducible M.EcoRII expression results in aza-C sensitivity
In panel A, extracts from HK21 cells with or without M.EcoRII plasmid pBAD-MEcoRII were analyzed by Western blotting. The cells were pre-grown with glucose for 1.5 generations, pelleted and washed with fresh LB, and then resuspended in LB containing glucose (0.2%) or arabinose (0.05%). Protein was extracted after 60 minutes of incubation at 37°C. In panel B, overnight cultures of HK21 (WT) or the ssrA derivative of HK21 (ssrA), with the indicated pBAD33-derived plasmid, were diluted to approximately 4 × 10⁸ cells/ml. Ten-fold serial dilutions were generated across a microtiter plate and 5 µl of each dilution was spotted onto LB plates with no drug or the indicated concentration of aza-C. The upper panels are plates that contained glucose (0.2%), while the lower panels are plates that contained arabinose (0.05%). Plates were photographed after overnight incubation at 37°C. The experiment comparing different M.EcoRII plasmids (panels with 3 rows) was done on a different day than the one comparing wild-type and ssrA mutant cells (panels with 2 rows); the latter plates were incubated for several hours longer to allow good growth of the ssrA mutant in the absence of aza-C. This may account for the somewhat weaker inhibition of the wild-type with M.EcoRII in row 9 compared to row 7 (however, we also detect some day-to-day variation in apparent aza-C potency in plates, perhaps due to aza-C instability).
Figure 4
Figure 4. Aza-C hypersensitivity of mutants with arabinose-inducible M.EcoRII
HK21 (WT) or the indicated HK21 derivatives (all containing the arabinose-inducible plasmid pBAD-MEcoRII) were tested for aza-C sensitivity as described in the legend to Fig. 3B.
Figure 5
Figure 5. SsrA tagging is induced by aza-C
HK21 (WT) or the indicated HK21 derivatives were grown for 2.25 generations in the presence of glucose (0.2%) with or without aza-C, and then washed out of the aza-C-containing media into LB with arabinose (0.05%). The presence of the wild-type or C186W M.EcoRII expressing pBAD-derived plasmid is indicated just below the genotype. Extracts were made after one-hour incubation at 37°C, and equal volumes of cell extract were then analyzed by Western blotting with an SsrA tag polyclonal antibody.
Figure 6
Figure 6. Aza-C hypersensitivity is relieved by ssrA-H6 mutant
Overnight cultures of strain HK22 ssrA::kan derivatives carrying two plasmids were diluted to 4 × 10⁸ cells/ml. The identities of the plasmids are indicated on the left: ssrA+ (pKW11); ssrA-H6 (pKW24); ΔssrA (pKW1); M.EcoRII (pR234); vector (pRK1). Ten-fold serial dilutions were generated across a microtiter plate and 5 µl of each dilution was spotted onto LB plates with no aza-C (left panels), aza-C at 2 µg/ml (middle panel), or aza-C at 5 µg/ml (right panel). Note that the level of sensitivity with this IPTG-inducible M.EcoRII expression plasmid appears somewhat higher than for the other two expression plasmids in previous experiments. Plates were photographed after overnight incubation at 37°C.
Figure 7
Figure 7. Sensitivity of ssrA and mfd strains to streptolydigin
Cultures contained EW1b (WT; panels A, C, E and F), EW1b ssrA mutant (ssrA; panel B), or EW1b mfd mutant (mfd; panel D) with the indicated plasmid (panels E and F) or no plasmid (panels A–D). Cells were innoculated (starting titer of approximately 2 × 10⁶ cells/ml) in wells that contained increasing concentrations of streptolydigin (see key at bottom), and grown at 37°C in a microplate reader with continuous shaking for 12 hours. Cell turbidity (OD630) was measured every 15 minutes. Plasmids pMFD19 and pBR322 confer ampicillin resistance, and these cultures also contained ampicillin at 50 µg/ml.
Figure 8
Figure 8. Isobolic test for synergy with Rho inhibitor bicyclomycin
Growth curves were measured in each well of a 96-well microtiter plate, with varying concentrations of bicyclomycin (right to left) and either aza-C or streptolydigin (top to bottom). The strain for the bicyclomycin/aza-C experiment was HK22 pBAD-MEcoRII, while the strain for the bicyclomycin/streptolydigin experiment was EW1B. A detailed description of the data analysis and processing are presented in the Supplemental Material. Briefly, at each concentration of bicyclomycin (Bcm), the concentration of aza-C (panel A) or streptolydigin (Stl; panel B) necessary to inhibit growth by 95% (blue), 75% (gold) or 50% (green) was estimated. In addition, the concentration of bicyclomycin necessary for those levels of growth inhibition (in the absence of the second drug) was estimated from the bicyclomycin inhibition curve. The data from each of 4 (panel A) or 3 (panel B) repetitions (on different days) were plotted with different symbols (squares, diamonds, circles and triangles). The dashed lines connect the average determined MIC value of each drug alone.

Similar articles

Cited by

References

    1. Abo T, Inada T, Ogawa A, Aiba H. SsrA-mediated tagging and proteolysis of Lacl and its role in the regulation of lac operon. EMBO J. 2000;19:3762–3769. - PMC - PubMed
    1. Abo T, Ueda K, Sunohara T, Ogawa K, Aiba H. SsrA-mediated protein tagging in the presence of miscoding drugs and its physiological role in Escherichia coli. Genes to Cells. 2002;7:629–638. - PubMed
    1. Baba T, Ara T, Hasegawa M, Takai Y, Okumura Y, Baba M, et al. Construction of Escherichia coli K-12 in-frame, single-gene knockout mutants: the Keio collection. Mol Sys Biol. 2006;2:1–11. - PMC - PubMed
    1. Bandaru B, Gopal J, Bhagwat AS. Overproduction of DNA cytosine methyltransferases causes methylation and C->T mutations at non-canonical sites. J Biol Chem. 1996;271:7851–7859. - PubMed
    1. Barbe J, Gibert I, Guerrero R. 5-Azacytidine - Survival and induction of the SOS response in Escherichia coli K-12. Mutat Res. 1986;166:9–16. - PubMed

Publication types

MeSH terms

LinkOut - more resources