. 2010 Nov 12;285(46):36060-9.
doi: 10.1074/jbc.M110.160879. Epub 2010 Aug 31.

Insulin-like 6 is induced by muscle injury and functions as a regenerative factor

Affiliations

Insulin-like 6 is induced by muscle injury and functions as a regenerative factor

Ling Zeng et al. J Biol Chem. .

Abstract

The insulin-like family of factors are involved in the regulation of a variety of physiological processes, but the function of the family member termed insulin-like 6 (Insl6) in skeletal muscle has not been reported. We show that Insl6 is a myokine that is up-regulated in skeletal muscle downstream of Akt signaling and in regenerating muscle in response to cardiotoxin (CTX)-induced injury. In the CTX injury model, myofiber regeneration was improved by the intramuscular or systemic delivery of an adenovirus expressing Insl6. Skeletal muscle-specific Insl6 transgenic mice exhibited normal muscle mass under basal conditions but elevated satellite cell activation and enhanced muscle regeneration in response to CTX injury. The Insl6-mediated regenerative response was associated with reductions in muscle cell apoptosis and reduced serum levels of creatine kinase M. Overexpression of Insl6 stimulated proliferation and reduced apoptosis in cultured myogenic cells. Conversely, knockdown of Insl6 reduced proliferation and increased apoptosis. These data indicate that Insl6 is an injury-regulated myokine that functions as a myogenic regenerative factor.


Figures

FIGURE 1.
FIGURE 1.
Up-regulation of Insl6 in Akt-activated skeletal muscle. Skeletal muscle-specific, Akt1 transgenic mice were treated with either doxycycline or vehicle for 2 weeks (A). Total RNA was isolated from GA muscles and subject to cDNA synthesis and microarray hybridization (left panel). Relative transcript of Insl6 (n = 3 in each group) from the microarray analysis. Relative transcript expression of Insl1, 3, 5, 6, and 7 in total RNA isolated from GA muscle of control and Akt-induced transgenic mice as measured by qRT-PCR (right panel). B, GA muscle lysate from control and Akt-induced transgenic mice were analyzed by Western blotting for Insl6 and GAPDH as a loading control. C, representative image of GA muscle sections from Akt-induced transgenic immunoblotted with Insl6 antibody (green) and hemagglutinin antibody (HA) that is fused to the Akt transgene (red). Sections from transgenic mice were double stained with anti-HA primary antibody with rhodamine-conjugated secondary antibody (red) and anti-Insl6 primary antibody with fluorescein-conjugated secondary antibody (green). A representative image is shown. Results are presented by mean ± S.E. *, p < 0.05; **, p < 0.01.
FIGURE 2.
FIGURE 2.
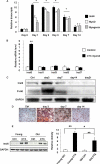
Insl6 expression in the cardiotoxin model of skeletal muscle injury. A cardiotoxin solution (10 μm) or an equal volume of PBS (control) was injected into TA muscle at 2 μl/g body weight. A, relative mRNA transcripts of Insl6 (black), MyoD (white), and Myogenin (gray) in CTX or PBS-injected TA muscle were assessed at the indicated time points by qRT-PCR (n = 4–5). Statistical comparisons were made between the indicated day and control (day 0) for each transcript. B, relative transcript expression of Insl1, -3, -5, -6, and -7 in TA muscle at 3 days post CTX (black) or PBS (white) injection were measured by qRT-PCR (n = 5). C, time course of Insl6 protein expression and the level of Akt phosphorylation at serine residue 473 in CTX-injured TA muscle relative to control (Ctrl). A representative immunoblot is shown. D, representative images of TA muscle sections stained with anti-Insl6 antibody at different time points after injury by CTX injection. E, aging skeletal muscle exhibits decreased Insl6 induction by injury. Western blot analysis of Insl6 in TA muscle samples obtained from young (2 months old) and aged (18 months old) C57Bl/6 mice 3 days after the CTX or PBS injection. The results are presented as the mean ± S.E., n = 5–6, **, p < 0.01; *, p < 0.05.
FIGURE 3.
FIGURE 3.
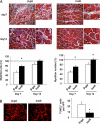
Intramuscular Adeno-Insl6 treatment facilitates muscle regeneration in the cardiotoxin model of skeletal muscle injury. Cardiotoxin solution was injected into TA muscle, and 5 × 10⁹ pfu of Adeno-βgal or Adeno-Insl6 was injected into the same muscle 48 h after the injury. A, representative image of H&E-stained TA muscle sections at day 7 and day 14 after the cardiotoxin injection. Histological analysis of muscle regeneration was performed by counting nascent myofiber number and measuring the total cross-section at day 7 post injury. Data are expressed as a percentage relative to the mean value of the Insl6-treated group at day 14 post-injury (n = 6–8 in each group). B, representative image of a TA muscle section stained for TUNEL for each experimental group at 7 days post-injury. Quantitative analysis of TUNEL-positive cells per high power microscopic field (HPF) was performed. The results are presented as the mean ± S.E. *, p < 0.05.
FIGURE 4.
FIGURE 4.
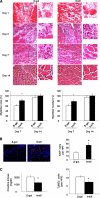
Systemic delivery of Adeno-Insl6 accelerates muscle repair. Cardiotoxin solution was injected into TA muscle, and 1 × 10¹⁰ pfu of either Adeno-βgal or Adeno-Insl6 was simultaneously injected into the jugular vein. A, representative image of H&E stained TA muscle cross-sections at day 1, 3, 7, and 14 postoperation. Muscle regeneration was quantified by counting nascent myofibers and myofiber cross-section area measurements. Data are expressed as a percentage relative to the mean value of the Insl6-treated group at day 14 post-injury (n = 4–5 in each group). B, representative image of Ki67 immunohistochemical staining of CTX-treated TA muscle at 3 days post-injury. Quantitative analysis of Ki67+ cells per high power microscopic field was performed (red, Ki67, blue, DAPI). C, creatine kinase levels were measured in serum at the different experimental groups at 7 days post-injury (left panel). TUNEL staining was performed on histological sections from CTX-treated TA muscle at 7 days post-injury (right panel). Data are presented as the mean ± S.E. *, p < 0.05.
FIGURE 5.
FIGURE 5.
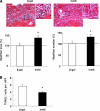
Insl6 overexpression promotes muscle regeneration in old mice. Approximately 10 μl of CTX solution (10 μm) was injected in 4 different positions on GA muscle. At 48 h after the injury, 5 × 10⁹ total pfu of Adeno-βgal or Adeno-Insl6 was also injected into 4 regions of GA muscle. A, representative image of H&E-stained GA muscle cross-sections at day 7 after the cardiotoxin injection (n = 4–6 in each group). Histological analysis of muscle regeneration was assessed by counting nascent myofibers and measuring myofiber cross-section area at day 7 post-injury. Data are expressed as a percentage relative to the mean value for the Adeno-βgal-treated group. B, in vivo TUNEL staining was performed, and positive cells are quantified in histological sections. Data are presented as the mean ± S.E. *, p < 0.05.
FIGURE 6.
FIGURE 6.
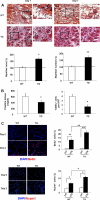
Insl6 transgenic mice exhibit improved muscle regeneration and enhanced satellite cell activation following CTX injury. A, representative images of H&E-stained TA muscle sections at day 1 and day 7 post-injury. Muscle regeneration was quantified in histological sections by counting nascent myofibers and measuring the cross-sectional area of myofibers at day 7. Data are expressed as a percentage relative to the mean value of WT mouse at 7 days post-injury. B, creatine kinase levels were measured in serum at day 7. TUNEL staining was performed on histological sections from the 7 day time point. C, representative images of TA muscle sections stained with BrdU or Ncam1 (red), with a DAPI counter stain (blue) at 2 days post injury (n = 6). Quantitative data are presented as the percentage of BrdU- or Ncam1-positive cells relative to the total number of DAPI-positive cells. The results are presented as the mean ± S.E. **, p < 0.01; *, p < 0.05.
FIGURE 7.
FIGURE 7.
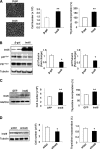
Insl6 is an endogenous regulator of muscle cell proliferation. A, C2C12 cells were transduced with adenovirus or siRNA reagent. [3H]thymidine pulse labeling was performed 48 h after the transfection. A representative image of C2C12 myoblasts transduced with Adeno-Insl6 or Adeno-β-gal is shown (left panel). Total cell number was assessed 48 h following adenovirus transduction. Data are expressed as a percentage relative to the mean of Adeno-βgal experimental group. B, Insl6 down-regulates cyclin-dependent kinase inhibitors p21Cip1 and p27Kip1. Cells were treated as in A and Insl6, p21Cip1 and p27Kip1 levels were determined by Western blot analysis. A representative blot is shown. The levels of p21Cip1 and p27Kip1 levels were quantified relative to the expression of tubulin that was used as a loading control. Data are expressed relative to the mean of the ratio of p21Cip1 or p27Kip1 relative to tubulin in the Adeno-βgal-treated cells (n = 6). C, human skeletal muscle primary cells were transduced as described above with Adeno-Insl6 or Adeno-GFP as control. A representative Western blot is shown to indicate Insl6 expression. The incorporation of [3H]thymidine into DNA and cell number was assessed at 48 h after transduction with adenovirus. D, Insl6 deficiency leads to cell growth retardation. C2C12 myoblasts were transfected with an siRNA targeting Insl6 or a negative control siRNA. A representative Western immunoblot is shown to indicate the degree of Insl6 ablation. The incorporation of [3H]thymidine and total cell number was assessed 48 h after treatment with siRNA. The values are presented by mean ± S.E. **, p < 0.01; *, p < 0.05.
FIGURE 8.
FIGURE 8.
Insl6 promotes C2C12 cell survival under conditions of CTX-induced stress. A, C2C12 cells transduced with Adeno-βgal or Adeno-Insl6 for 16 h followed by 24 h of incubation with 100 nm CTX. Cellular apoptosis was quantified by measuring cytoplasm histone-associated-DNA-fragments and homogenous caspase 3/7 activity. B, C2C12 cells were transduced with Insl6 or non-related siRNA for 16 h followed by 24 h of incubation with 100 nm of CTX. Cellular apoptosis was quantified as described above. Values are mean ± S.E. Data are expressed as a proportion relative to the mean value of the control group. **, p < 0.01; *, p < 0.05. n = 6 per group.

Similar articles

Cited by

References

    1. Takahashi A., Kureishi Y., Yang J., Luo Z., Guo K., Mukhopadhyay D., Ivashchenko Y., Branellec D., Walsh K. (2002) Mol. Cell. Biol. 22, 4803–4814 - PMC - PubMed
    1. Arany Z., Foo S. Y., Ma Y., Ruas J. L., Bommi-Reddy A., Girnun G., Cooper M., Laznik D., Chinsomboon J., Rangwala S. M., Baek K. H., Rosenzweig A., Spiegelman B. M. (2008) Nature 451, 1008–1012 - PubMed
    1. Ouchi N., Oshima Y., Ohashi K., Higuchi A., Ikegami C., Izumiya Y., Walsh K. (2008) J. Biol. Chem. 283, 32802–32811 - PMC - PubMed
    1. Pedersen B. K., Febbraio M. (2005) Brain Behav. Immun 19, 371–376 - PubMed
    1. Izumiya Y., Bina H. A., Ouchi N., Akasaki Y., Kharitonenkov A., Walsh K. (2008) FEBS Lett. 582, 3805–3810 - PMC - PubMed

MeSH terms

Substances