. 2010 Nov 5;285(45):34477-84.
doi: 10.1074/jbc.M110.133561. Epub 2010 Aug 31.

Dissecting the biological role of mucin-type O-glycosylation using RNA interference in Drosophila cell culture

Affiliations

Dissecting the biological role of mucin-type O-glycosylation using RNA interference in Drosophila cell culture

Liping Zhang et al. J Biol Chem. .

Abstract

Mucin type O-glycosylation is a highly conserved form of post-translational modification initiated by the family of enzymes known as the polypeptide α-N-acetylgalactosaminyltransferases (ppGalNAcTs in mammals and PGANTs in Drosophila). To address the cellular functions of the many PGANT family members, RNA interference (RNAi) to each pgant gene was performed in two independent Drosophila cell culture lines. We demonstrate that RNAi to individual pgant genes results in specific reduction in gene expression without affecting the expression of other family members. Cells with reduced expression of individual pgant genes were then examined for changes in viability, morphology, adhesion, and secretion to assess the contribution of each family member to these cellular functions. Here we find that RNAi to pgant3, pgant6, or pgant7 resulted in reduced secretion, further supporting a role for O-glycosylation in proper secretion. Additionally, RNAi to pgant3 or pgant6 resulted in altered Golgi organization, suggesting a role for each in establishing or maintaining proper secretory apparatus structure. Other subcellular effects observed included multinucleated cells seen after RNAi to either pgant2 or pgant35A, suggesting a role for these genes in the completion of cytokinesis. These studies demonstrate the efficient and specific knockdown of pgant gene expression in two Drosophila cell culture systems, resulting in specific morphological and functional effects. Our work provides new information regarding the biological roles of O-glycosylation and illustrates a new platform for interrogating the cellular and subcellular effects of this form of post-translational modification.


Figures
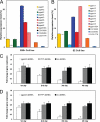
FIGURE 1.
FIGURE 1.
Expression of pgants in Drosophila S2R+ and S2 cells and time course of RNAi-mediated transcript knockdown. Expression levels of pgant genes in S2R+ (A) and S2 (B) cells as determined by quantitative real time PCR. RNA levels were normalized to GAPDH. The time course shows reduction in pgant3 gene expression after RNAi treatment for 1, 2, 3, or 4 days as determined by quantitative PCR for S2R+ (C) and S2 (D) cells. Shown are data from cells treated with no dsRNA, dsRNA to YFP (negative control), or dsRNA to pgant3. RNA levels were normalized to 18 S rRNA. S.D. are shown.
FIGURE 2.
FIGURE 2.
Morphological analysis of S2R+ and S2 cells treated with dsRNA to each pgant. S2R+ (A) and S2 (B) cells were treated with dsRNA to the gene denoted at the top of each box and were then stained to visualize the actin cytoskeleton (phalloidin, red) and nuclei (DAPI, blue). WT = no dsRNA treatment. Black size bar = 20 μm.
FIGURE 3.
FIGURE 3.
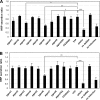
RNAi to certain pgants in S2R+ and S2 cells results in decreased secretion. S2R+ (A) and S2 (B) cells were transfected with the inducible pMT-ss-HRP-V5 secretion reporter construct (18) and treated with dsRNA to each pgant, pitslre (positive control), or YFP or untreated as described under “Experimental Procedures.” After induction, HRP secreted into the media was quantitated, normalized, and expressed as HRP secretion ratio as described under “Experimental Procedures.” Error bars = S.D. *, p < 0.05; **, p < 0.01; ***, p < 0.001.
FIGURE 4.
FIGURE 4.
Golgi staining of S2R+ and S2 cells treated with dsRNA to each pgant. S2R+ (A) and S2 (B) cells were treated with dsRNA to each gene denoted at the top of each box and were then stained to visualize the Golgi apparatus using the anti-GM130 antibody (green) and nuclei (DAPI, blue). C, S2R+ cells were also stained with the anti-dSyx16 antibody (red). WT = no dsRNA treatment. Black size bar = 20 μm.

Similar articles

Cited by

References

    1. Ten Hagen K. G., Fritz T. A., Tabak L. A. (2003) Glycobiology 13, 1R–16R - PubMed
    1. Hang H. C., Bertozzi C. R. (2005) Bioorg. Med. Chem. 13, 5021–5034 - PubMed
    1. Tian E., Ten Hagen K. G. (2009) Glycoconj. J. 26, 325–334 - PMC - PubMed
    1. Ten Hagen K. G., Zhang L., Tian E., Zhang Y. (2009) Glycobiology 19, 102–111 - PMC - PubMed
    1. Ten Hagen K. G., Tran D. T. (2002) J. Biol. Chem. 277, 22616–22622 - PubMed

Publication types

MeSH terms

LinkOut - more resources