

A cell-permeable Stat3 SH2 domain mimetic inhibits Stat3 activation and induces antitumor cell effects in vitro
- PMID: 20807764
- PMCID: PMC2975209
- DOI: 10.1074/jbc.M110.154088
A cell-permeable Stat3 SH2 domain mimetic inhibits Stat3 activation and induces antitumor cell effects in vitro
Abstract
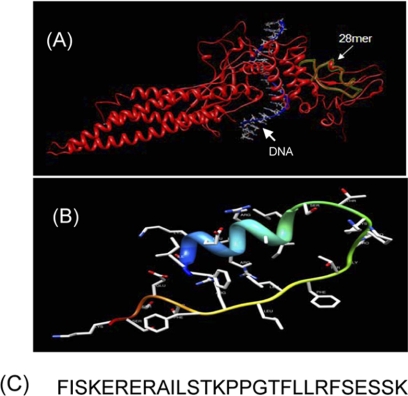
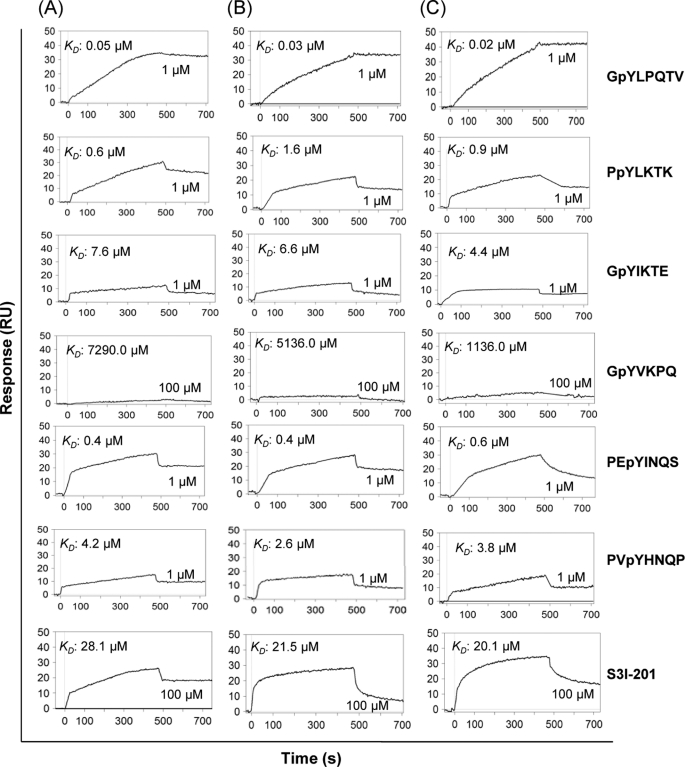
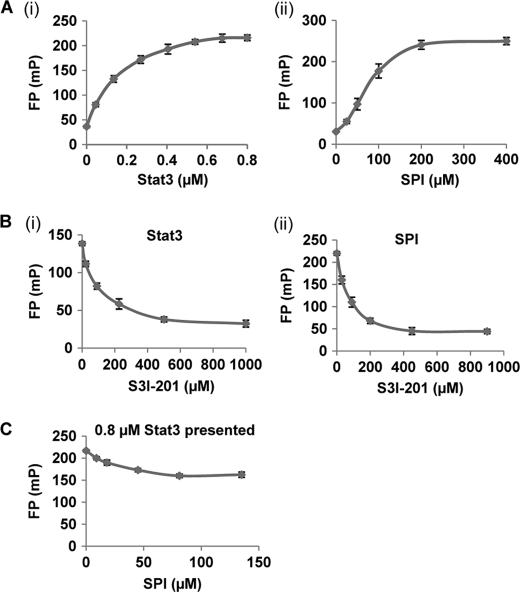
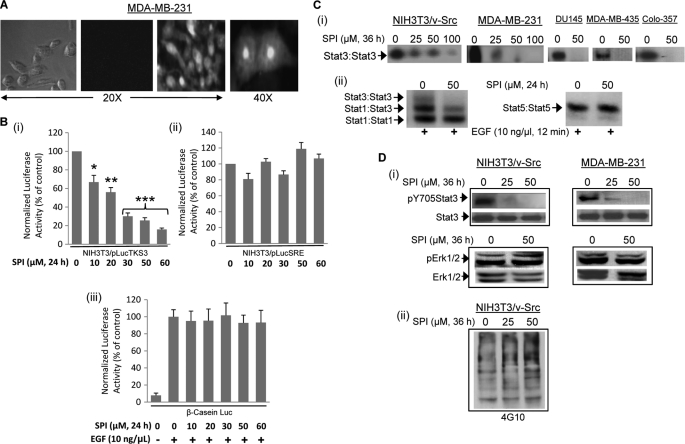
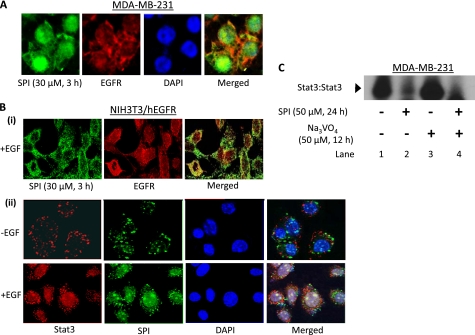
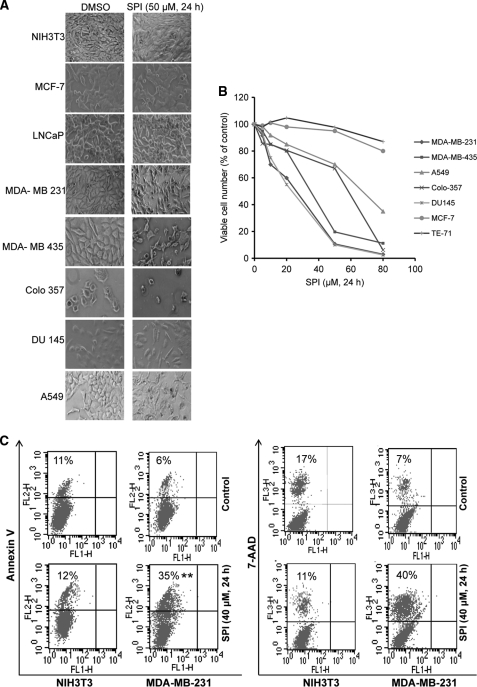
Given the role of constitutively active Signal Transducer and Activator of Transcription (Stat) 3 in human tumors, Stat3 inhibitors would be useful as novel therapeutics and as tools for probing Stat3-mediated tumor processes. We herein report that a 28-mer peptide, SPI, derived from the Stat3 SH2 domain, replicates Stat3 biochemical properties. Studies show SPI and Stat3 (or Stat3 SH2 domain) bind with similar affinities to known Stat3-binding phosphotyrosine (pY) peptide motifs, including those of the epidermal growth factor receptor (EGFR) and the high-affinity, IL-6R/gp130-derived pY-peptide, GpYLPQTV-NH(2). Consequently, SPI functions as a potent and selective inhibitor of Stat3 SH2 domain:pTyr interactions and disrupts the binding of Stat3 to the IL-6R/gp130 peptide, GpYLPQTV-NH(2). Fluorescence imaging and immunofluorescence staining/laser-scanning confocal microscopy show SPI is cell membrane-permeable, associates with the cytoplasmic tail of EGFR in NIH3T3/hEGFR, and is present in the cytoplasm, but strongly localized at the plasma membrane and in the nucleus in malignant cells harboring persistently active Stat3. Moreover, SPI specifically blocks constitutive Stat3 phosphorylation, DNA binding activity, and transcriptional function in malignant cells, with little or no effect on the induction of Stat1, Stat5, and Erk1/2(MAPK) pathways, or on general pTyr profile at the concentrations that inhibit Stat3 activity. Significantly, treatment with SPI of human breast, pancreatic, prostate, and non-small cell lung cancer cells harboring constitutively active Stat3 induced extensive morphology changes, associated with viability loss and apoptosis. Our study identifies SPI as a novel molecular probe for interrogating Stat3 signaling and that functions as a selective inhibitor of Stat3 activation with antitumor cell effects.
Figures
Similar articles
-
A novel small-molecule disrupts Stat3 SH2 domain-phosphotyrosine interactions and Stat3-dependent tumor processes.Biochem Pharmacol. 2010 May 15;79(10):1398-409. doi: 10.1016/j.bcp.2010.01.001. Epub 2010 Jan 11. Biochem Pharmacol. 2010. PMID: 20067773 Free PMC article.
-
Novel peptidomimetic inhibitors of signal transducer and activator of transcription 3 dimerization and biological activity.Mol Cancer Ther. 2004 Mar;3(3):261-9. Mol Cancer Ther. 2004. PMID: 15026546
-
Phosphotyrosyl peptides block Stat3-mediated DNA binding activity, gene regulation, and cell transformation.J Biol Chem. 2001 Nov 30;276(48):45443-55. doi: 10.1074/jbc.M107527200. Epub 2001 Sep 28. J Biol Chem. 2001. PMID: 11579100
-
STAT 3 as a target for cancer drug discovery.Curr Med Chem. 2008;15(9):834-43. doi: 10.2174/092986708783955464. Curr Med Chem. 2008. PMID: 18473793 Review.
-
Increasing the range of drug targets: interacting peptides provide leads for the development of oncoprotein inhibitors.Bioengineered. 2012 Nov-Dec;3(6):320-5. doi: 10.4161/bioe.21272. Epub 2012 Jul 24. Bioengineered. 2012. PMID: 22825353 Free PMC article. Review.
Cited by
-
Unraveling the complexity of STAT3 in cancer: molecular understanding and drug discovery.J Exp Clin Cancer Res. 2024 Jan 20;43(1):23. doi: 10.1186/s13046-024-02949-5. J Exp Clin Cancer Res. 2024. PMID: 38245798 Free PMC article. Review.
-
HO-3867, a safe STAT3 inhibitor, is selectively cytotoxic to ovarian cancer.Cancer Res. 2014 Apr 15;74(8):2316-27. doi: 10.1158/0008-5472.CAN-13-2433. Epub 2014 Mar 3. Cancer Res. 2014. PMID: 24590057 Free PMC article.
-
Antagonism of the Stat3-Stat3 protein dimer with salicylic acid based small molecules.ChemMedChem. 2011 Aug 1;6(8):1459-70. doi: 10.1002/cmdc.201100194. Epub 2011 May 25. ChemMedChem. 2011. PMID: 21618433 Free PMC article.
-
The Role of Natural Products as Inhibitors of JAK/STAT Signaling Pathways in Glioblastoma Treatment.Oxid Med Cell Longev. 2022 Sep 19;2022:7838583. doi: 10.1155/2022/7838583. eCollection 2022. Oxid Med Cell Longev. 2022. PMID: 36193062 Free PMC article. Review.
-
Signal transducer and activator of transcription-3 and breast cancer prognosis.Am J Cancer Res. 2011;1(3):347-55. Am J Cancer Res. 2011. PMID: 21776434 Free PMC article.
References
Publication types
MeSH terms
Substances
Grants and funding
LinkOut - more resources
Full Text Sources
Other Literature Sources
Research Materials
Miscellaneous
