. 2010 Nov 12;285(46):35836-47.
doi: 10.1074/jbc.M110.166512. Epub 2010 Aug 31.

Mechanism of phosphorylation-induced activation of phospholipase C-gamma isozymes

Affiliations

Mechanism of phosphorylation-induced activation of phospholipase C-gamma isozymes

Aurelie Gresset et al. J Biol Chem. .

Abstract

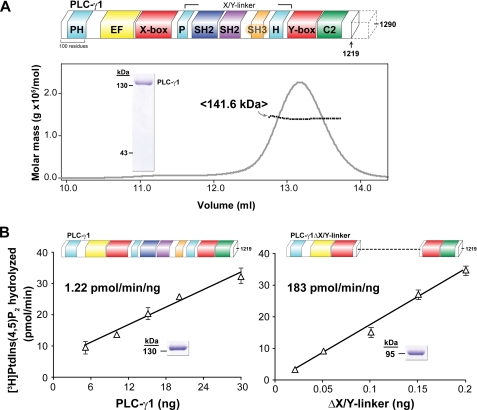
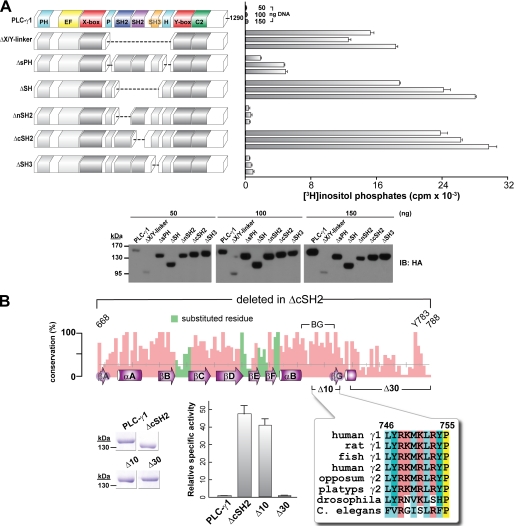
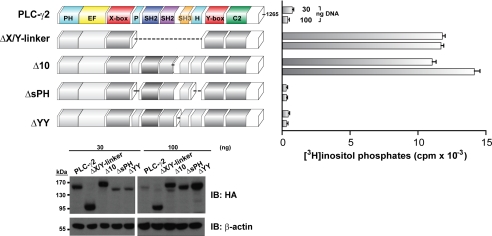
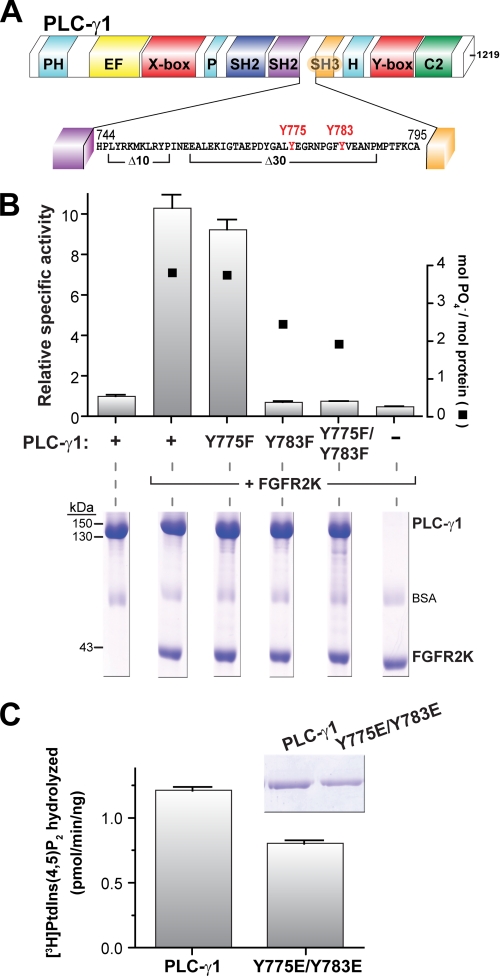
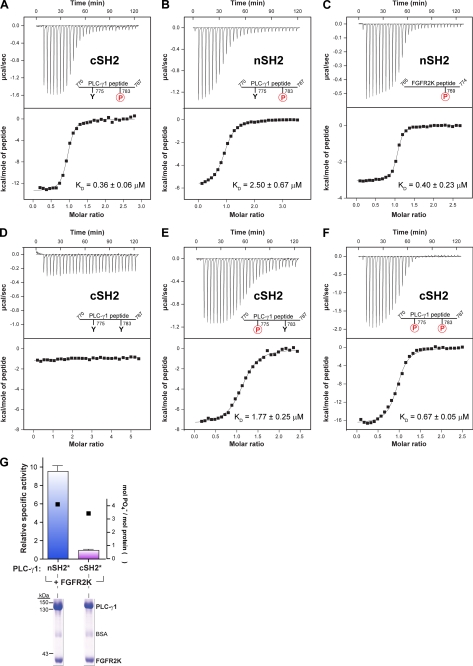
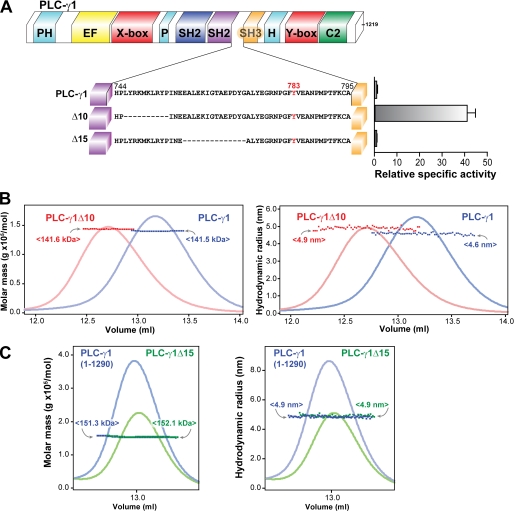
The lipase activity of most phospholipases C (PLCs) is basally repressed by a highly degenerate and mostly disordered X/Y linker inserted within the catalytic domain. Release of this auto-inhibition is driven by electrostatic repulsion between the plasma membrane and the electronegative X/Y linker. In contrast, PLC-γ isozymes (PLC-γ1 and -γ2) are structurally distinct from other PLCs because multiple domains are present in their X/Y linker. Moreover, although many tyrosine kinases directly phosphorylate PLC-γ isozymes to enhance their lipase activity, the underlying molecular mechanism of this activation remains unclear. Here we define the mechanism for the unique regulation of PLC-γ isozymes by their X/Y linker. Specifically, we identify the C-terminal SH2 domain within the X/Y linker as the critical determinant for auto-inhibition. Tyrosine phosphorylation of the X/Y linker mediates high affinity intramolecular interaction with the C-terminal SH2 domain that is coupled to a large conformational rearrangement and release of auto-inhibition. Consequently, PLC-γ isozymes link phosphorylation to phospholipase activation by elaborating upon primordial regulatory mechanisms found in other PLCs.


Figures

FIGURE 1.
FIGURE 1.
Purified PLC-γ1 is monomeric and auto-inhibited by its X/Y linker. A, purified PLC-γ1 is monomeric. Schematic representation of full-length rat PLC-γ1 (upper panel). PLC isozymes contain a conserved core consisting of an N-terminal PH domain (cyan), an array of four EF hands (yellow), a catalytic TIM barrel composed of X and Y boxes (red), and a C-terminal C2 domain (green). PLC-γ isozymes are unique in containing multiple domains within the X/Y linker: a split PH domain (cyan), two SH2 domains (navy and purple), and an SH3 domain (gold). The C terminus (dotted outline) of PLC-γ is degenerate; unless otherwise noted, studies reported here used PLC-γ1 truncated at residue 1219. Lower panel, elution of PLC-γ1 from a size exclusion column and monitored by absorbance (gray line) was simultaneously analyzed with multi-angle light scattering (black line) to provide a mean molecular mass of 141.6 kDa consistent with a monomer (calculated molecular mass of 140.1 kDa). Purity of PLC-γ1 protein (2 μg, inset) was assessed by SDS-PAGE analysis followed by staining with Coomassie Brilliant Blue. B, removal of the X/Y linker constitutively activates purified PLC-γ1. Lipase activity of purified PLC-γ1 (left panel) or PLC-γ1ΔX/Y linker (right panel) was measured at the indicated protein concentrations using mixed detergent-phospholipid micelles. The indicated specific activities are the means of at least three independent experiments. Purity (2 μg, inset) of PLC-γ1 proteins was assessed by SDS-PAGE analysis followed by Coomassie Brilliant Blue staining. See also supplemental Fig. S1.
FIGURE 2.
FIGURE 2.
Deletion mapping delineates a 10-residue span within the X/Y linker of PLC-γ1 critical for auto-inhibition. A, systematic deletion of the domains in the X/Y linker implicate the C-terminal SH2 domain in mediating auto-inhibition. HEK293 cells were transfected with the indicated amounts of DNA encoding either wild-type PLC-γ1 or the indicated deleted forms (left) prior to quantification of [3H]inositol phosphates (right). Vector alone was subtracted from all of the measurements. The data shown are the means ± S.D. of triplicate samples and are representative of three or more independent experiments. Western blotting (bottom) of cell lysates confirmed expression of PLC-γ1 deletion constructs. B, high resolution mutational mapping of the C-terminal SH2 domain highlights 10 residues required for auto-inhibition. Top panel, bar chart plotting the percentage of identity per position of a multiple sequence alignment of 22 PLC-γ orthologs spanning the region deleted (residues 668–788) in rat PLC-γ1ΔcSH2. Also shown on this chart are the secondary structure elements (purple) of the crystal structure of the cSH2 domain (Protein Data Bank entry 3GQI) with the nomenclature proposed by Harrison and co-workers (37); two deletions (Δ10, red; Δ30, blue) introduced into PLC-γ1; and Tyr783 required to be phosphorylated during receptor-mediated lipase activation. Green bars highlight sites of substitution to alanine in PLC-γ1 yielding no change in [3H]inositol phosphate accumulation after transfection of mutant DNAs into HEK293 cell (data not shown). In contrast, purified PLC-γ1 proteins (bottom left panel) indicate that PLC-γ1ΔcSH2 and PLC-γ1Δ10 have comparable constitutive activation (bottom middle panel). A subset of the multiple sequence alignment spanning Δ10 is shown in the bottom right panel. Specific activities are the means ± S.E. of at least three independent experiments using phospholipid vesicles and normalized to wild-type activity. Purified proteins (2 μg; bottom left panel) were assessed by SDS-PAGE followed by staining with Coomassie Brilliant Blue. See also supplemental Fig. S2.
FIGURE 3.
FIGURE 3.
PLC-γ1 and -γ2 are auto-inhibited by analogous portions of the X/Y linker. HEK293T cells were transfected with the indicated amount of DNA encoding either wild-type PLC-γ2 or the deleted forms of PLC-γ2 (left panel) prior to quantification of [3H]inositol phosphates (right panel). Vector alone was subtracted from all measurements. The data are the means ± S.D. of triplicate samples and are representative of three or more independent experiments. Western blotting of HEK293T cell lysates confirmed expression of PLC-γ2 constructs.
FIGURE 4.
FIGURE 4.
Phosphorylation, but not phosphomimetic mutation, of tyrosine 783 enhances the lipase activity of purified PLC-γ1. A, expanded view of PLC-γ1 sequence between the C-terminal SH2 and SH3 domains. Tyrosines previously implicated in phosphorylation-dependent activation of the lipase are highlighted in red. Also marked are deletions (Δ10 and Δ30) described in Fig. 2. B, phosphorylation of tyrosine 783, but not tyrosine 775, activates PLC-γ1. Equimolar concentrations of purified PLC-γ1 or the indicated phospho-deficient forms were incubated with purified, constitutively active kinase domain of FGFR2 (FGFR2K) and [γ-32P]ATP in BSA-containing buffer. Aliquots of reaction mixtures were subsequently tested for: (i) lipase activity in phospholipid vesicles (left y axis) and (ii) incorporation of [γ-32P]phosphate into PLC-γ1 (right y axis) after SDS-PAGE followed by staining with Coomassie Brilliant Blue (lower panel). Specific activities are the means ± S.E. of three or more independent experiments and normalized to basal activity of wild-type PLC-γ1. C, phosphomimetic mutations of tyrosines 775 and 783 are insufficient to enhance the lipase activity of PLC-γ1. The specific activity of either purified PLC-γ1 or the doubly mutated (Y775E/Y783E) form was measured in mixed detergent-phospholipid micelles. The data are the means ± S.D. of triplicate samples and are representative of three or more independent experiments. The purity (2 μg, inset) of PLC-γ1 proteins was assessed by SDS-PAGE followed by staining with Coomassie Brilliant Blue. See also supplemental Fig. S3.
FIGURE 5.
FIGURE 5.
Phosphorylated tyrosine 783 must interact with the C-terminal SH2 domain for activation of purified PLC-γ1. A–F, phosphorylation of Tyr783 mediates high affinity interaction with the C-terminal SH2 domain of PLC-γ1. Heats evolved from titration of individual SH2 domains of PLC-γ1 (nSH2 or cSH2) with indicated peptides of PLC-γ1 or FGFRK2 were measured with isothermal titration calorimetery and used to derive associated dissociation constants (KD). The range of residues are indicated for the peptides as well as phosphorylated (circled red P) and nonphosphorylated tyrosines (Y). The top panels show the base line-corrected heats of titration; the bottom panels show the integrated heat released as a function of the molar ratio of peptide titrated into the sample cell. The data were corrected for the heat of dilution of the peptide and subsequently fit to a one-site model using a nonlinear least squares algorithm to obtain the associated KD values. Measured thermodynamic parameters are given in supplemental Table S1. G, mutations within the phosphotyrosine-binding pocket of the C-terminal SH2 domain of PLC-γ1 prevent receptor-mediated lipase activation. PLC-γ1 was mutated to prevent binding of phosphotyrosine to either the N-terminal (nSH2*) or C-terminal (cSH2*) SH2 domain, purified, and incubated with an equimolar concentration of purified FGFR2K and [γ-32P]ATP. Aliquots of the reaction mixtures were subsequently quantified for: (i) lipase activity using phospholipid vesicles (left y axis) and (ii) incorporation of [γ-32P]phosphate in PLC-γ1 (right y axis) after SDS-PAGE and staining with Coomassie Brilliant Blue (lower panel). Specific activities are the means ± S.E. for three or more independent experiments and are normalized to wild-type activity. See also supplemental Table S1.
FIGURE 6.
FIGURE 6.
PLC-γ1 adopts an extended conformation upon activation. A, specific activity of either purified PLC-γ1 or the indicated deleted forms was measured in phospholipid vesicles. The relative specific activities are the means ± S.E. for three or more independent experiments and are normalized to wild-type activity. Note that the data for PLC-γ1 and PLC-γ1Δ10 are repeated from Fig. 2 and are shown here for comparative purposes. B and C, SEC-MALS analysis of either PLC-γ1Δ10 (B) or PLC-γ1Δ15 (C) compared with wild-type PLC-γ1. Molar mass (left panels; dark colored squares) and hydrodynamic radius (right panels; dark colored squares) of the indicated proteins were assessed by multi-angle light scattering as a function of elution volume (light colored curves; relative absorbance) after application to a Superdex 200 size exclusion column. The mean molecular masses (amounts in angle brackets) and hydrodynamic radii for elutions are color-coded to the indicated proteins. Note that in C, PLC-γ1Δ15 was generated within the context of full-length PLC-γ1 (1290 residues) and therefore compared with it.
FIGURE 7.
FIGURE 7.
Mechanism for phosphorylation-stimulated increase in PLC-γ1 lipase activity. In the absence of stimulus, the catalytic domain (gray doughnut) of PLC-γ1 is basally auto-inhibited by the cSH2 domain (purple cylinder). Activation of RTKs (gold) provides a phosphotyrosine (red dot) docking site for the nSH2 domain (blue cylinder) of PLC-γ1, thereby translocating PLC-γ1 from the cytosol to the plasma membrane. RTKs then phosphorylate PLC-γ1 at a specific tyrosine, which promotes direct interactions with the cSH2 domain. Engagement of the cSH2 domain by phosphorylated tyrosine induces structural rearrangements of the cSH2 domain with respect to the catalytic domain, leading to release of auto-inhibition and subsequent substrate hydrolysis.

Similar articles

Cited by

References

    1. Harden T. K., Sondek J. (2006) Annu. Rev. Pharmacol. Toxicol. 46, 355–379 - PubMed
    1. Rhee S. G. (2001) Annu. Rev. Biochem. 70, 281–312 - PMC - PubMed
    1. Essen L. O., Perisic O., Cheung R., Katan M., Williams R. L. (1996) Nature 380, 595–602 - PubMed
    1. Hicks S. N., Jezyk M. R., Gershburg S., Seifert J. P., Harden T. K., Sondek J. (2008) Mol. Cell 31, 383–394 - PMC - PubMed
    1. Horstman D. A., Chattopadhyay A., Carpenter G. (1999) Arch. Biochem. Biophys. 361, 149–155 - PubMed

Publication types

MeSH terms

LinkOut - more resources