Review
. 2011 Jan 1;589(Pt 1):49-57.
doi: 10.1113/jphysiol.2010.192666. Epub 2010 Aug 31.

The neural basis of visual attention

Affiliations
Review

The neural basis of visual attention

James W Bisley. J Physiol. .

Abstract

Visual attention is the mechanism the nervous system uses to highlight specific locations, objects or features within the visual field. This can be accomplished by making an eye movement to bring the object onto the fovea (overt attention) or by increased processing of visual information in neurons representing more peripheral regions of the visual field (covert attention). This review will examine two aspects of visual attention: the changes in neural responses within visual cortices due to the allocation of covert attention; and the neural activity in higher cortical areas involved in guiding the allocation of attention. The first section will highlight processes that occur during visual spatial attention and feature-based attention in cortical visual areas and several related models that have recently been proposed to explain this activity. The second section will focus on the parietofrontal network thought to be involved in targeting eye movements and allocating covert attention. It will describe evidence that the lateral intraparietal area, frontal eye field and superior colliculus are involved in the guidance of visual attention, and describe the priority map model, which is thought to operate in at least several of these areas.


Figures
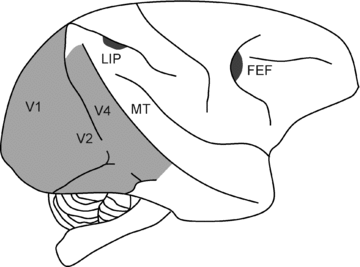
Figure 1
Figure 1. Illustration of the primate brain
The locations of visual areas containing neurons whose responses are modulated by visual attention are shown in light grey. Cortical areas involved in the allocation of attention and the guidance of eye movements are shown in dark grey. The superior colliculus, also involved in this process, is not visible. MT, the middle temporal area; LIP, the lateral intraparietal area; FEF, the frontal eye field.
Figure 2
Figure 2. Studying the effects of attention on MT neurons
A, the two main ways that the effects of attention have been studied in visual cortices. Usually at least 1 preferred stimulus (a direction of motion or oriented bar) and 1 non-preferred stimulus (the opposite direction of motion or a bar rotated 90 deg from the preferred orientation) are presented on the screen. Either a single stimulus is placed in the receptive field (left panel), with the other stimulus in an opposite location, or both stimuli are placed in the receptive field (right panel). B, the response of a population of 70 MT neurons under 5 attentional conditions (illustrated on right). The dashed grey oval represents the receptive field (RF), the cross represents the fixation point (FP), and the black cone illustrates the focus of attention. Adapted from Lee & Maunsell (2010) with permission from the Society for Neuroscience.
Figure 3
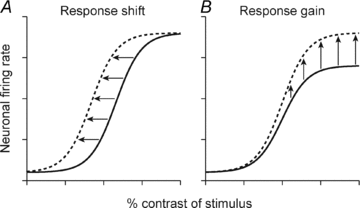
Figure 3. Theoretical effects of attention on the contrast response function
A, the response shift model predicts that the response to an attended stimulus of a given contrast is the same as the response to an unattended stimulus of higher contrast. Thus, attention is similar to turning up the brightness of the stimulus. B, the response gain model predicts that the response to an attended stimulus of a given contrast, is a multiplicative increase in response to that contrast. Thus, attention is similar to just turning up the gain of the response. Note that the response gain model (B) suggests that the peak response to a bright stimulus can be increased, whereas the response shift model (A) does not. Continuous lines, unattended contrast response functions; dashed lines, attended contrast response functions.
Figure 4
Figure 4. Evidence of shifting covert attention in frontal eye field (FEF)
A, in this experiment, monkeys had to fixate on a small point (the fixation point, FP) and covertly find a target amongst 3 distractors. Based on the behavioural data, the authors found that the monkeys were serially attending the stimuli in a clockwise direction (illustrated by the dashed line). B, the responses (illustrated as z-scores by the colour coding) of FEF neurons are aligned by the onset of the choice saccade and are sorted based on where the target was relative to the preferred location (RF). Asterisks show significance with Bonferroni correction, dots show uncorrected significant. Adapted from Buschman & Miller (2009) with permission from Elselvier.
Figure 5
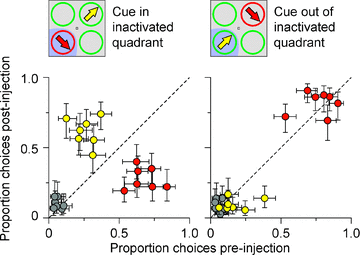
Figure 5. Inactivation of the superior colliculus (SC) creates a deficit in the allocation of attention
In this experiment, monkeys were cued by a red circle to pay attention to a stimulus in a region of visual space represented by inactivated SC neurons (left panel) or in the opposite location (right panel). The animals had to indicate the direction of a pulse of motion in the cued location (red) and ignore a pulse of motion in the opposite location (yellow). These graphs show the proportion of choices made when the monkey correctly indicated the direction of the cued motion pulse (red points), indicated the direction of the motion pulse in the distractor location (yellow points) and did not indicate either of these directions (grey) before and after an injection of muscimol. Adapted from Lovejoy & Krauzlis (2010) with permission from Macmillan Publishers Ltd: Nature Neuroscience, ©2010.
Figure 6
Figure 6. Theoretical priority map response during visual search
A, stimulus arrangement and eye movements (white dashed lines) in a hypothetical visual search task. B, theoretical responses on a priority map to the search performed in A. Red stimuli are represented by low activity, blue stimuli are represented by higher activity. Bars oriented the same way as the target are represented by greater activity than bars that are not. The bright yellow pop-out stimulus is represented by elevated activity due to its inherent salience. The middle blue bar that had just been fixated is represented by reduced activity.

References

    1. Adair JC, Barrett AM. Spatial neglect: clinical and neuroscience review: a wealth of information on the poverty of spatial attention. Ann N Y Acad Sci. 2008;1142:21–43. - PMC - PubMed
    1. Andersen RA, Asanuma C, Essick G, Siegel RM. Corticocortical connections of anatomically and physiologically defined subdivisions within the inferior parietal lobule. J Comp Neurol. 1990;296:65–113. - PubMed
    1. Armstrong KM, Fitzgerald JK, Moore T. Changes in visual receptive fields with microstimulation of frontal cortex. Neuron. 2006;50:791–798. - PubMed
    1. Balan PF, Gottlieb J. Integration of exogenous input into a dynamic salience map revealed by perturbing attention. J Neurosci. 2006;26:9239–9249. - PMC - PubMed
    1. Balan PF, Gottlieb J. Functional significance of nonspatial information in monkey lateral intraparietal area. J Neurosci. 2009;29:8166–8176. - PMC - PubMed

Publication types

LinkOut - more resources