

PTEN loss accelerates KrasG12D-induced pancreatic cancer development
- PMID: 20807812
- PMCID: PMC2940963
- DOI: 10.1158/0008-5472.CAN-10-1649
PTEN loss accelerates KrasG12D-induced pancreatic cancer development
Abstract
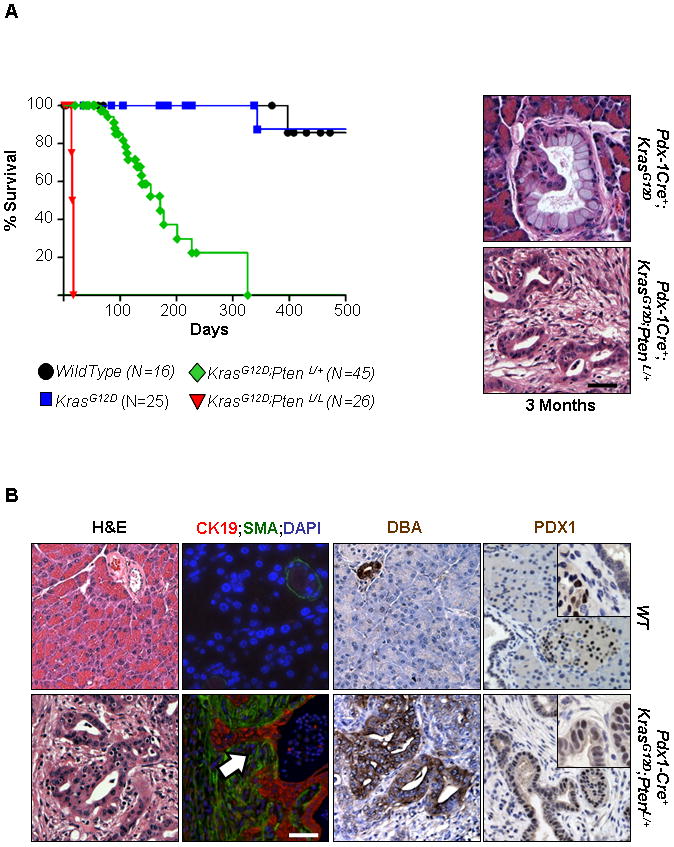
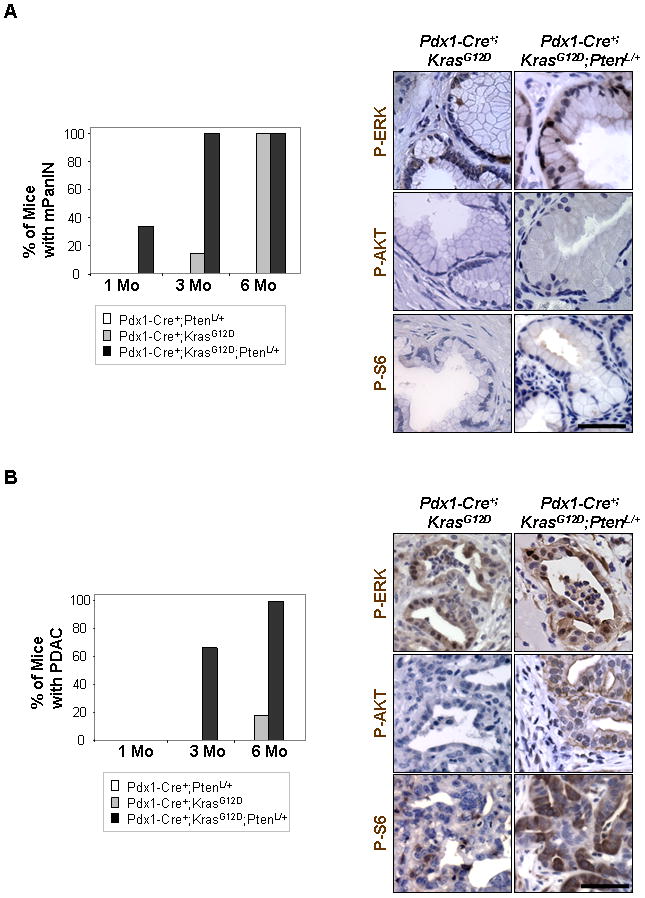
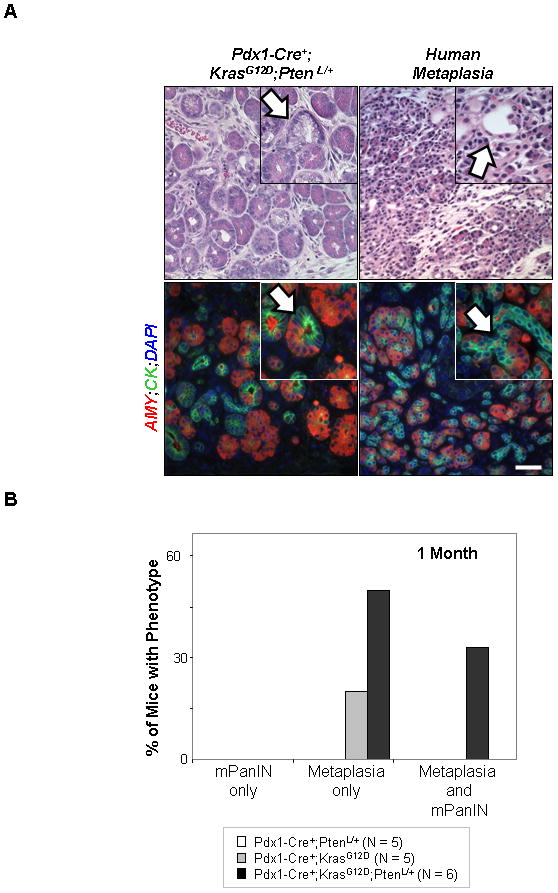
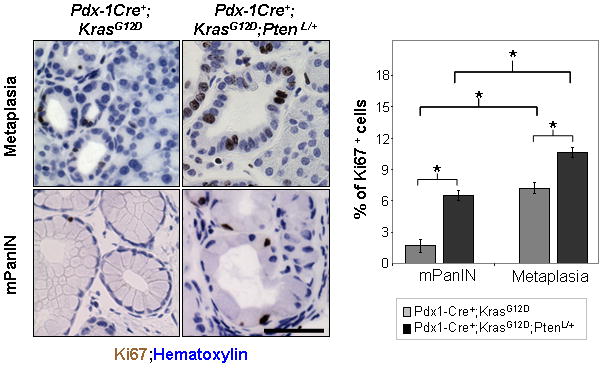
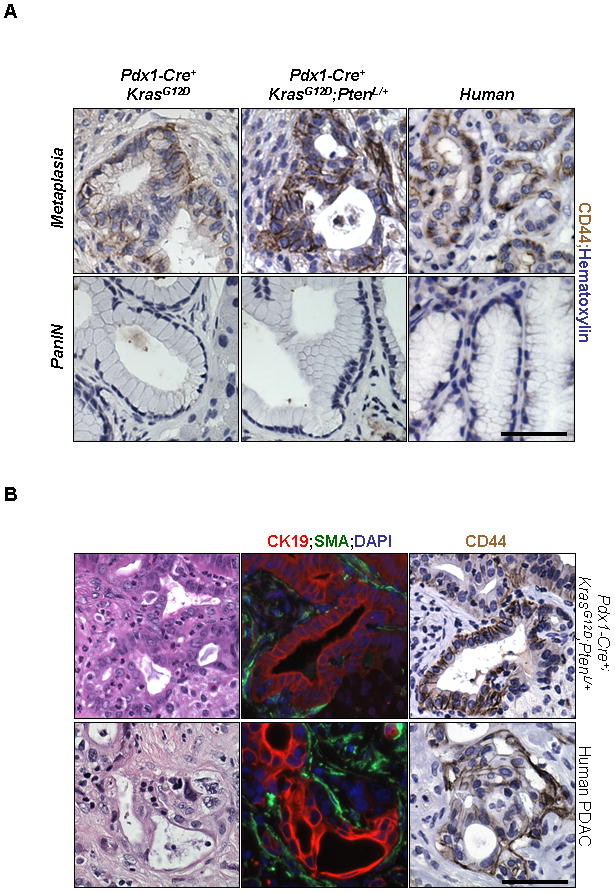
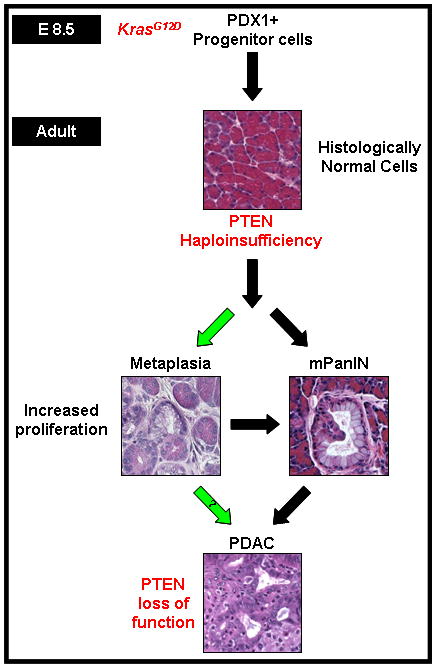
KRAS mutations are found in ∼90% of human pancreatic ductal adenocarcinomas (PDAC). However, mice genetically engineered to express Kras(G12D) from its endogenous locus develop PDACs only after a prolonged latency, indicating that other genetic events or pathway alterations are necessary for PDAC progression. The PTEN-controlled phosphatidylinositol 3-kinase (PI3K)/AKT signaling axis is dysregulated in later stages of PDAC. To better elucidate the role of PTEN/PI3K/AKT signaling in Kras(G12D)-induced PDAC development, we crossed Pten conditional knockout mice (Pten(lox/lox)) to mice with conditional activation of Kras(G12D). The resulting compound heterozygous mutant mice showed significantly accelerated development of acinar-to-ductal metaplasia (ADM), malignant pancreatic intraepithelial neoplasia (mPanIN), and PDAC within a year. Moreover, all mice with Kras(G12D) activation and Pten homozygous deletion succumbed to cancer by 3 weeks of age. Our data support a dosage-dependent role for PTEN, and the resulting dysregulation of the PI3K/AKT signaling axis, in both PDAC initiation and progression, and shed additional light on the signaling mechanisms that lead to the development of ADM and subsequent mPanIN and pancreatic cancer.
©2010 AACR.
Conflict of interest statement
No potential conflicts of interest.
Figures
Similar articles
-
Loss of Pten and Activation of Kras Synergistically Induce Formation of Intraductal Papillary Mucinous Neoplasia From Pancreatic Ductal Cells in Mice.Gastroenterology. 2018 Apr;154(5):1509-1523.e5. doi: 10.1053/j.gastro.2017.12.007. Epub 2017 Dec 19. Gastroenterology. 2018. PMID: 29273451 Free PMC article.
-
Loss of Somatostatin Receptor Subtype 2 Promotes Growth of KRAS-Induced Pancreatic Tumors in Mice by Activating PI3K Signaling and Overexpression of CXCL16.Gastroenterology. 2015 Jun;148(7):1452-65. doi: 10.1053/j.gastro.2015.02.009. Epub 2015 Feb 13. Gastroenterology. 2015. PMID: 25683115
-
Krüppel-like Factor 5, Increased in Pancreatic Ductal Adenocarcinoma, Promotes Proliferation, Acinar-to-Ductal Metaplasia, Pancreatic Intraepithelial Neoplasia, and Tumor Growth in Mice.Gastroenterology. 2018 Apr;154(5):1494-1508.e13. doi: 10.1053/j.gastro.2017.12.005. Epub 2017 Dec 15. Gastroenterology. 2018. PMID: 29248441 Free PMC article.
-
KRAS-Dependency in Pancreatic Ductal Adenocarcinoma: Mechanisms of Escaping in Resistance to KRAS Inhibitors and Perspectives of Therapy.Int J Mol Sci. 2023 May 26;24(11):9313. doi: 10.3390/ijms24119313. Int J Mol Sci. 2023. PMID: 37298264 Free PMC article. Review.
-
KRAS: feeding pancreatic cancer proliferation.Trends Biochem Sci. 2014 Feb;39(2):91-100. doi: 10.1016/j.tibs.2013.12.004. Epub 2014 Jan 2. Trends Biochem Sci. 2014. PMID: 24388967 Free PMC article. Review.
Cited by
-
Pancreatic Ductal Organoids React Kras Dependent to the Removal of Tumor Suppressive Roadblocks.Stem Cells Int. 2019 May 19;2019:2079742. doi: 10.1155/2019/2079742. eCollection 2019. Stem Cells Int. 2019. PMID: 31236113 Free PMC article.
-
Vav1 and mutant K-Ras synergize in the early development of pancreatic ductal adenocarcinoma in mice.Life Sci Alliance. 2020 Apr 10;3(5):e202000661. doi: 10.26508/lsa.202000661. Print 2020 May. Life Sci Alliance. 2020. PMID: 32277014 Free PMC article.
-
Biomarkers as predictors of recurrence following curative resection for pancreatic ductal adenocarcinoma: a review.Biomed Res Int. 2014;2014:468959. doi: 10.1155/2014/468959. Epub 2014 Jun 24. Biomed Res Int. 2014. PMID: 25050350 Free PMC article. Review.
-
PTEN-Dependent Stabilization of MTSS1 Inhibits Metastatic Phenotype in Pancreatic Ductal Adenocarcinoma.Neoplasia. 2018 Jan;20(1):12-24. doi: 10.1016/j.neo.2017.10.004. Epub 2017 Nov 23. Neoplasia. 2018. PMID: 29175021 Free PMC article.
-
Resveratrol inhibits cancer cell metabolism by down regulating pyruvate kinase M2 via inhibition of mammalian target of rapamycin.PLoS One. 2012;7(5):e36764. doi: 10.1371/journal.pone.0036764. Epub 2012 May 4. PLoS One. 2012. PMID: 22574221 Free PMC article.
References
-
- Bardeesy N, Sharpless NE, DePinho RA, Merlino G. The genetics of pancreatic adenocarcinoma: a roadmap for a mouse model. Semin Cancer Biol. 2001;11(3):201–18. - PubMed
-
- Hingorani SR, Petricoin EF, Maitra A, et al. Preinvasive and invasive ductal pancreatic cancer and its early detection in the mouse. Cancer Cell. 2003;4(6):437–50. - PubMed
-
- Kojima K, Vickers SM, Adsay NV, et al. Inactivation of Smad4 accelerates Kras(G12D)-mediated pancreatic neoplasia. Cancer Res. 2007;67(17):8121–30. - PubMed
Publication types
MeSH terms
Substances
Grants and funding
LinkOut - more resources
Full Text Sources
Other Literature Sources
Medical
Molecular Biology Databases
Research Materials
Miscellaneous
