. 2010 Nov;154(3):1196-209.
doi: 10.1104/pp.110.158519. Epub 2010 Aug 31.

The autophagic degradation of chloroplasts via rubisco-containing bodies is specifically linked to leaf carbon status but not nitrogen status in Arabidopsis

Affiliations

The autophagic degradation of chloroplasts via rubisco-containing bodies is specifically linked to leaf carbon status but not nitrogen status in Arabidopsis

Masanori Izumi et al. Plant Physiol. 2010 Nov.

Abstract

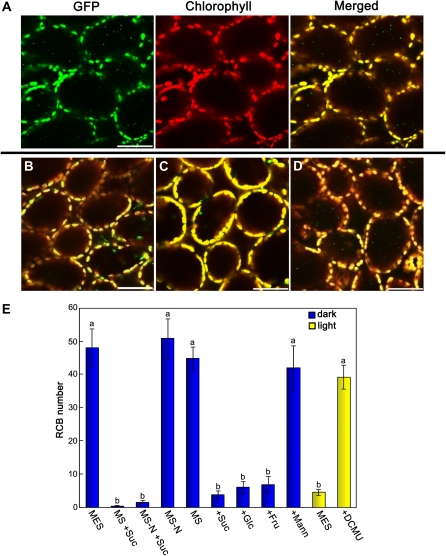
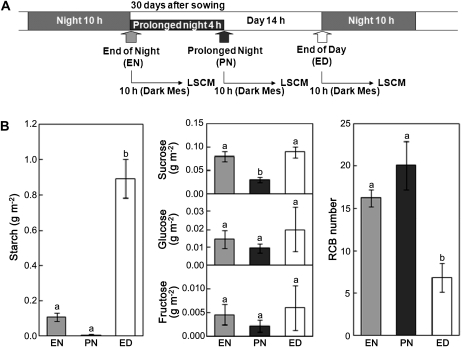
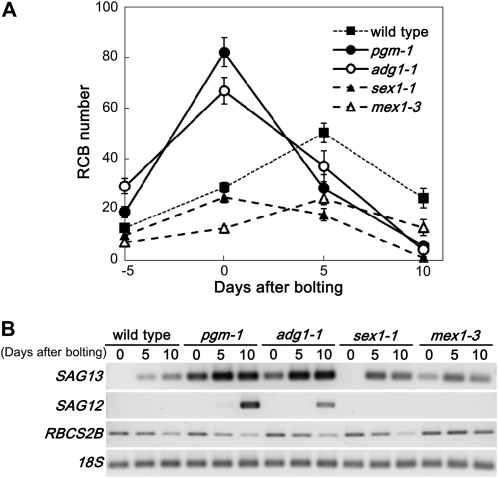
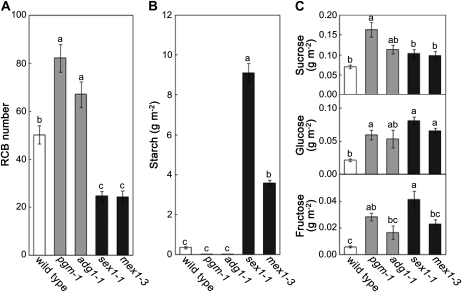
Autophagy is an intracellular process facilitating the vacuolar degradation of cytoplasmic components and is important for nutrient recycling during starvation. We previously demonstrated that chloroplasts can be partially mobilized to the vacuole by autophagy via spherical bodies named Rubisco-containing bodies (RCBs). Although chloroplasts contain approximately 80% of total leaf nitrogen and represent a major carbon and nitrogen source for new growth, the relationship between leaf nutrient status and RCB production remains unclear. We examined the effects of nutrient factors on the appearance of RCBs in leaves of transgenic Arabidopsis (Arabidopsis thaliana) expressing stroma-targeted fluorescent proteins. In excised leaves, the appearance of RCBs was suppressed by the presence of metabolic sugars, which were added externally or were produced during photosynthesis in the light. The light-mediated suppression was relieved by the inhibition of photosynthesis. During a diurnal cycle, RCB production was suppressed in leaves excised at the end of the day with high starch content. Starchless mutants phosphoglucomutase and ADP-Glc pyrophosphorylase1 produced a large number of RCBs, while starch-excess mutants starch-excess1 and maltose-excess1 produced fewer RCBs. In nitrogen-limited plants, as leaf carbohydrates were accumulated, RCB production was suppressed. We propose that there exists a close relationship between the degradation of chloroplast proteins via RCBs and leaf carbon but not nitrogen status in autophagy. We also found that the appearance of non-RCB-type autophagic bodies was not suppressed in the light and somewhat responded to nitrogen in excised leaves, unlike RCBs. These results imply that the degradation of chloroplast proteins via RCBs is specifically controlled in autophagy.


Figures

Figure 1.
Figure 1.
Effects of incubation conditions on the appearance of Rubisco-containing bodies. A to D, Visualization of RCBs by stroma-targeted GFP in various incubation conditions. Fourth leaves of stroma-targeted GFP expressing Arabidopsis at 30 d after sowing (5 d after bolting) were excised and incubated in 10 mm MES-NaOH (pH 5.5) with 1 μm concanamycin A and 100 μm E-64d at 23°C for 20 h in darkness (A), with 3% (w/v) Suc in darkness (B), in the light (C), or with DCMU in the light (D). GFP appears green, and chlorophyll fluorescence appears red. In merged images, overlap of GFP and chlorophyll fluorescence appears yellow. In B, C, and D, merged images are shown. Bars = 50 μm. E, The number of RCBs in various incubation conditions. Excised leaves were incubated as described in A to D in darkness (blue columns) or in the light (yellow columns) and with various constituents: MES, no other constituent; MS, MS medium; MS-N, nitrogen-free MS medium; +Suc, 3% (w/v) Suc; +Glc, 3% (w/v) Glc; +Fru, 3% (w/v) Fru; +Mann, 3% (w/v) mannitol; +DCMU, 10 μm DCMU. Leaves from four independent plants were incubated, eight quadrangular regions (188 μm × 188 μm each) per leaf were monitored by LSCM, and the number of accumulated RCBs was counted (RCB number). Each image was considered as an independent data point and subjected to statistical analysis by Tukey’s test. Data represent means ± se (n = 32). Columns with the same letter were not significantly different (P ≤ 0.01).
Figure 2.
Figure 2.
Changes in starch, Suc, Glc, and Fru contents in incubated leaves. Excised leaves from transgenic Arabidopsis at 30 d after sowing were incubated at 23°C for 8 h or for 20 h in 10 mm MES-NaOH (pH 5.5) with 1 μm concanamycin A and 100 μm E-64d in darkness (black squares), in the light (white circles), or with 10 μm DCMU in the light (white triangles), and carbohydrate content was determined. Data represent means ± se (n = 3).
Figure 3.
Figure 3.
Effects of incubation conditions on the appearance of RCBs and autophagic bodies. A and B, Visualization of both RCBs and autophagic bodies. Excised leaves from both GFP-ATG8- and stroma-targeted DsRed-expressing plants at 25 d after sowing (5 d after bolting) were incubated at 23°C for 20 h in 10 mm MES-NaOH (pH 5.5) with 1 μm concanamycin A and 100 μm E-64d in darkness (A) or in the light (B). GFP appears green and DsRed appears red. In merged images, overlap of GFP and DsRed appears yellow. Bars = 10 μm. C, The appearance of RCBs and non-RCB-type autophagic bodies in various incubation conditions. Excised leaves from GFP-ATG8- and stroma-targeted DsRed-expressing plants were incubated as described in A and B in darkness or in the light with various constituents: MES, no other constituent; MS, MS medium; MS-N, nitrogen-free MS medium; +Suc, 3% (w/v) Suc; +N, nitrogen nutrition of MS medium; +DCMU, 10 μm DCMU. Leaves from six independent plants were incubated, eight quadrangular regions (188 μm × 188 μm each) per leaf were monitored by LSCM, and the number of accumulated RCBs (red columns) and non-RCB-type autophagic bodies not containing DsRed (green columns) were counted. Each image was considered as an independent data point and subjected to statistical analysis by Tukey’s test. Each value is shown as a percentage of the level in “dark MES.” Data represent means ± se (n = 64). Values with the same letter were not significantly different in RCBs (red values) and non-RCB-type autophagic bodies (green values; P ≤ 0.05).
Figure 4.
Figure 4.
Effects of timing of leaf excision in a diurnal cycle on the appearance of RCBs. A, Schematic representation of this experiment. Fourth leaves of stroma-targeted GFP transgenic plants at 30 d after sowing were excised at the end of the regular night cycle (EN) or after 4 h of prolonged night (PN) or the end of the day (ED) in a day cycle. B, The leaf carbohydrate contents and the appearance of RCBs. The contents of starch (left) and Suc, Glc, and Fru (center) in leaves at the end of the night (gray columns), after the prolonged night (black columns), and the end of the day (white columns) were determined. Excised leaves at each point were incubated at 23°C for 10 h in 10 mm MES-NaOH (pH 5.5) with 1 μm concanamycin A and 100 μm E-64d in darkness. Leaves from four independent plants were incubated, eight quadrangular regions (188 μm × 188 μm each) per leaf were monitored by LSCM, and the number of accumulated RCBs was counted (right). Data represent means ± se (n = 3–4 [carbohydrate contents] or 32 [RCB number]). Statistical analysis was performed by Tukey’s test. Columns with the same letter were not significantly different (P ≤ 0.05).
Figure 5.
Figure 5.
The leaf carbohydrate contents in starch-related mutants under continuous illumination. A, Photograph of wild-type, starchless mutant (pgm-1, adg1-1), and starch-excess mutant (sex1-1, mex1-3) plants expressing stroma-targeted GFP grown for 26 d after sowing (5 d after bolting) in continuous illumination (60 μmol quanta m−2 s−1). B, The leaf carbohydrate contents in the wild type and starch-related mutants. The contents of starch (left) and Suc, Glc, and Fru (right) were determined in leaves of stroma-targeted GFP transgenic plants of background wild type, pgm-1, adg1-1, sex1-1, or mex1-3 at 26 d after sowing. Data represent means ± se (n = 3). Statistical analysis was performed by Tukey’s test. Columns with the same letter were not significantly different (P ≤ 0.05).
Figure 6.
Figure 6.
Effects of mutations affecting leaf starch content on the appearance of RCBs. A to E, Visualization of RCBs in leaves of starch-related mutants. Transgenic plants expressing stroma-targeted GFP of background wild type (A), pgm-1 (B), adg1-1 (C), sex1-1 (D), or mex1-3 (E) were incubated at 23°C for 20 h in 10 mm MES-NaOH (pH 5.5) with 1 μm concanamycin A and 100 μm E-64d in darkness and observed with LSCM. GFP appears green and chlorophyll fluorescence appears red. Merged images are shown. Bars = 50 μm. F, The appearance of RCBs in leaves of starch-related mutants. Leaves excised from five independent plants of the wild type and each mutant were incubated, eight quadrangular regions (188 μm × 188 μm each) per leaf were monitored by LSCM, and the number of accumulated RCBs was counted. Data represent means ± se (n = 40). Statistical analysis was performed by Tukey’s test. Columns with the same letter were not significantly different (P ≤ 0.05).
Figure 7.
Figure 7.
Effects of mutations affecting leaf starch content on the appearance of RCBs throughout leaf life span under a 14-h photoperiod. A, Changes of the appearance of RCBs in leaves of starch-related mutants under a 14-h photoperiod. Leaves of stroma-targeted GFP transgenic plants of background wild type (black squares), pgm-1 (black circles), adg1-1 (white circles), sex1-1 (black triangles), or mex1-3 (white triangles) were excised 5 d before bolting and 0, 5, and 10 d after bolting. Leaves were incubated at 23°C for 20 h in 10 mm MES-NaOH (pH 5.5) with 1 μm concanamycin A and 100 μm E-64d in darkness. Leaves from six independent plants were incubated, eight quadrangular regions (188 μm × 188 μm each) per leaf were monitored by LSCM, and the number of accumulated RCBs was counted at each stage. Data represent means ± se (n = 48). B, The transcription levels of SAG13, SAG12, and RBCS2B as marker genes for leaf senescence. Total RNA from third and fourth leaves of stroma-targeted GFP transgenic plants of background wild type and each mutant during 10 d after bolting was isolated and subjected to semiquantitative reverse transcription-PCR using gene-specific primers. PCR products were separated by electrophoresis, stained with SYBR Green I, and quantified by a fluorescence image analyzer. 18S ribosomal RNA was used as an internal control.
Figure 8.
Figure 8.
The leaf carbohydrate contents in starch-related mutants under a 14-h photoperiod. A, The maximum number of accumulated RCBs in incubated leaves throughout leaf life span. The maximum number of accumulated RCBs in leaves of stroma-targeted GFP transgenic plants of background wild type, pgm-1, adg1-1, sex1-1, or mex1-3 was excerpted from Figure 7A. B and C, The leaf carbohydrate contents when the appearance of RCBs was maximum. The contents of starch (B) and Suc, Glc, and Fru (C) were determined in fourth leaves at 4 to 6 h into the photoperiod at 5 d after bolting in wild-type and mex1-3 plants or at bolting in pgm-1, adg1-1, and sex1-1, when the appearance of RCBs after leaf incubation was maximum in Figure 7A. Data represent means ± se (n = 48 [RCB number] or 4 [carbohydrate contents]). Statistical analysis was performed by Tukey’s test. Columns with the same letter were not significantly different (P ≤ 0.05).
Figure 9.
Figure 9.
Nitrogen-limited senescence. A, Photographs of plants under nitrogen-sufficient condition as a control (top image) or nitrogen-limited condition (bottom image) at 5 d after treatment. Stroma-targeted GFP-expressing plants were hydroponically grown with nitrogen-rich solution. When plants started bolting (23 d after sowing), hydroponic solution was replaced with either the same nitrogen-rich solution as the control or nitrogen-free solution, and plants were grown for 5 d. Bars = 10 mm. B, Changes in the chlorophyll, nitrogen, soluble protein, and Rubisco protein contents in leaves of plants under nitrogen-sufficient (black squares) and nitrogen-limited (white circles) conditions over the treatment period. Data represent means ± se (n = 3).
Figure 10.
Figure 10.
Effects of nitrogen limitation on the appearance of RCBs and leaf carbohydrate contents. A, Effects of nitrogen limitation on the appearance of RCBs. Fourth leaves of stroma-targeted GFP-expressing plants under nitrogen-sufficient (black squares) and nitrogen-limited (white circles) conditions were excised over the treatment period and incubated at 23°C for 20 h in 10 mm MES-NaOH (pH 5.5) with 1 μm concanamycin A and 100 μm E-64d in darkness. Leaves from four independent plants were incubated, eight quadrangular regions (188 μm × 188 μm each) per leaf were monitored by LSCM, and the number of accumulated RCBs was counted at each period. Data represent means ± se (n = 32). B, The leaf carbohydrate contents in nitrogen-limited plants. Changes in the starch, Suc, Glc, and Fru contents were measured in fourth leaves of plants under nitrogen-sufficient (black squares) and nitrogen-limited (white circles) conditions over the treatment period. Data represent means ± se (n = 3).

Similar articles

Cited by

References

    1. Acevedo-Hernández GJ, León P, Herrera-Estrella LR. (2005) Sugar and ABA responsiveness of a minimal RBCS light-responsive unit is mediated by direct binding of ABI4. Plant J 43: 506–519 - PubMed
    1. Arnon DI. (1949) Copper enzymes in isolated chloroplasts: polyphenoloxidase in Beta vulgaris. Plant Physiol 24: 1–15 - PMC - PubMed
    1. Aubert S, Gout E, Bligny R, Marty-Mazars D, Barrieu F, Alabouvette J, Marty F, Douce R. (1996) Ultrastructural and biochemical characterization of autophagy in higher plant cells subjected to carbon deprivation: control by the supply of mitochondria with respiratory substrates. J Cell Biol 133: 1251–1263 - PMC - PubMed
    1. Barth C, Moeder W, Klessig DF, Conklin PL. (2004) The timing of senescence and response to pathogens is altered in the ascorbate-deficient Arabidopsis mutant vitamin c-1. Plant Physiol 134: 1784–1792 - PMC - PubMed
    1. Bassham DC. (2009) Function and regulation of macroautophagy in plants. Biochim Biophys Acta 1793: 1397–1403 - PubMed

Publication types

LinkOut - more resources