

Quantitative volumetric perfusion mapping of the microvasculature using contrast ultrasound
- PMID: 20808232
- PMCID: PMC3822908
- DOI: 10.1097/RLI.0b013e3181ef0a78
Quantitative volumetric perfusion mapping of the microvasculature using contrast ultrasound
Abstract
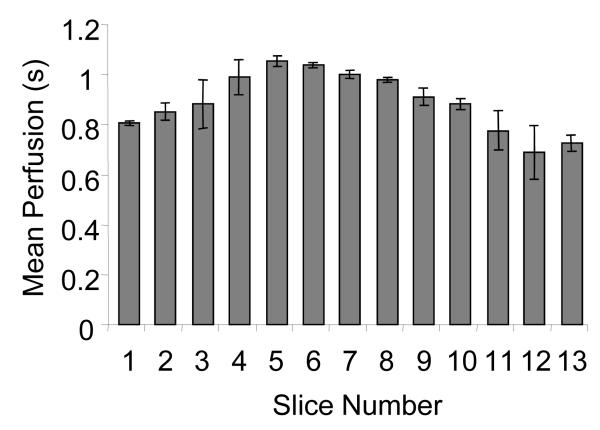
Objectives: Contrast-enhanced ultrasound imaging has demonstrated significant potential as a noninvasive technology for monitoring blood flow in the microvasculature. With the application of nondestructive contrast imaging pulse sequences combined with a clearance-refill approach, it is possible to create quantitative time-to-refill maps of tissue correlating to blood perfusion rate. One limitation to standard two-dimensional (2D) perfusion imaging is that the narrow elevational beamwidth of 1- or 1.5-D ultrasound transducers provides information in only a single slice of tissue, and thus it is difficult to image exactly the same plane from study to study. We hypothesize that inhomogeneity in vascularization, such as that common in many types of tumors, makes serial perfusion estimates inconsistent unless the same region can be imaged repeatedly. Our objective was to evaluate error in 2D quantitative perfusion estimation in an in vivo sample volume because of differences in transducer positioning. To mitigate observed errors due to imaging plane misalignment, we propose and demonstrate the application of quantitative 3-dimensional (3D) perfusion imaging. We also evaluate the effect of contrast agent concentration and infusion rate on perfusion estimates.
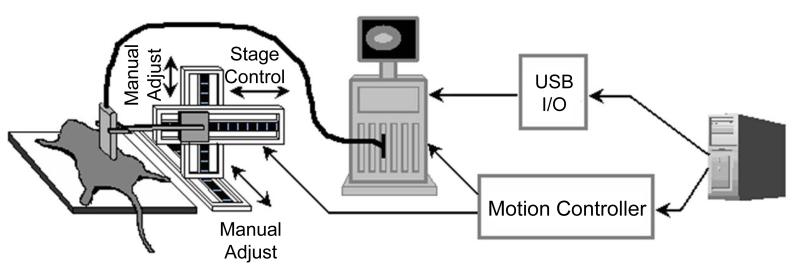
Materials and methods: Contrast-enhanced destruction-reperfusion imaging was performed using parametric mapping of refill times and custom software for image alignment to compensate for tissue motion. Imaging was performed in rats using a Siemens Sequoia 512 imaging system with a 15L8 transducer. A custom 3D perfusion mapping system was designed by incorporating a computer-controlled positioning system to move the transducer in the elevational direction, and the Sequoia was interfaced to the motion system for timing of the destruction-reperfusion sequence and data acquisition. Perfusion estimates were acquired from rat kidneys as a function of imaging plane and in response to the vasoactive drug dopamine.
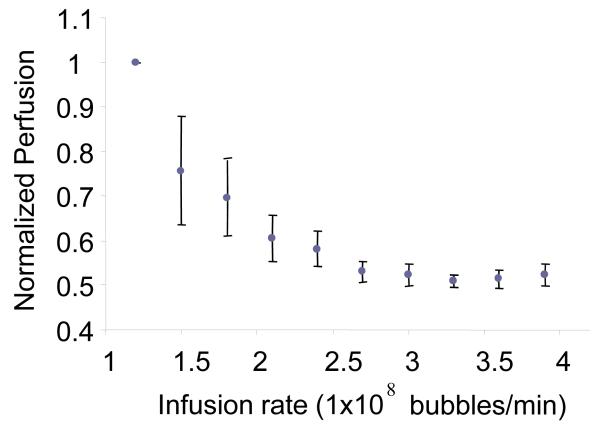
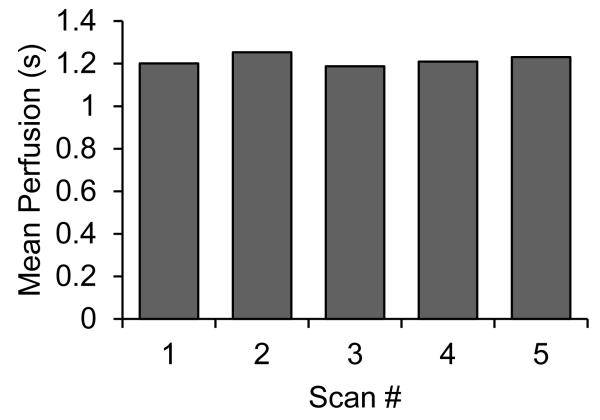
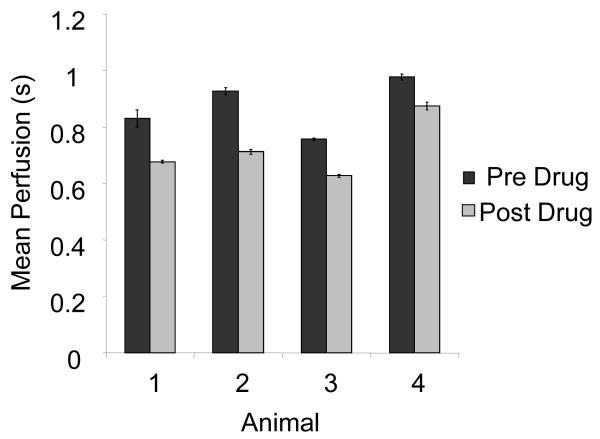
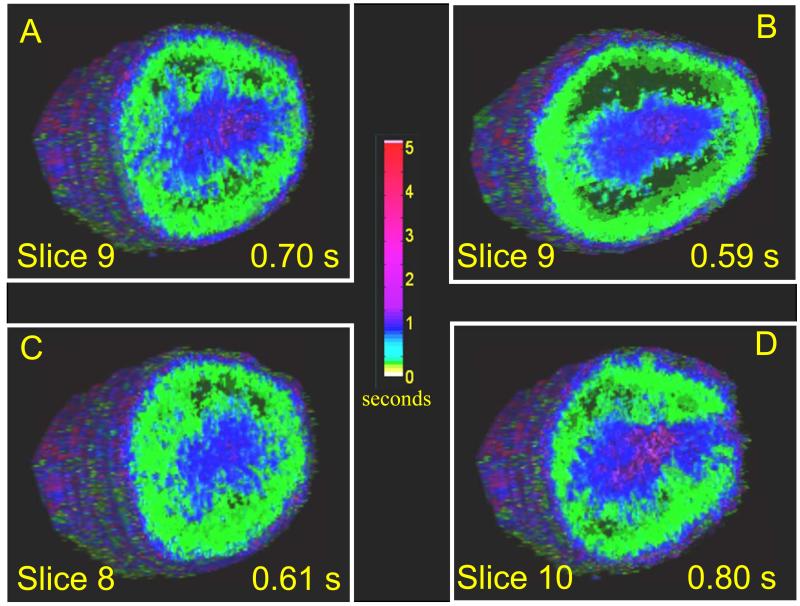
Results: Our results indicate that perfusion estimates generated by 2D imaging in the rat kidney have mean standard deviations on the order of 10%, and as high as 22%, because of differences in initial transducer position. This difference was larger than changes in kidney perfusion induced by dopamine. With application of 3D perfusion mapping, repeatability in perfusion estimated in the kidney is reduced to a standard deviation of less than 3%, despite random initial transducer positioning. Varying contrast agent administration rate was also observed to bias measured perfusion time, especially at low concentrations; however, we observed that contrast administration rates between 2.7 × 10(8) and 3.9 × 10(8) bubbles/min provided results that were consistent within 3% for the contrast agent type evaluated.
Conclusions: Three-dimensional perfusion imaging allows a significant reduction in the error caused by transducer positioning, and significantly improves the reliability of quantitative perfusion time estimates in a rat kidney model. When performing perfusion imaging, it is important to use appropriate and consistent contrast agent infusion rates to avoid bias.
Figures
References
-
- Dayton PA, Rychak JJ. Molecular ultrasound imaging using microbubble contrast agents. Frontiers in Bioscience. 2007;12:5124–5142. - PubMed
-
- Goldberg BB, Raichlen JS, Forsberg F. Ultrasound Contrast Agents, basic principles and clinical applications. Martin Dunitz Ltd.; London: 2001.
-
- Chomas JE, Dayton P, May D, et al. Threshold of fragmentation for ultrasonic contrast agents. J Biomed Opt. 2001;6(2):141–50. - PubMed
-
- Wei K, Jayaweera AR, Firoozan S, et al. Quantification of myocardial blood flow with ultrasound-induced destruction of microbubbles administered as a constant venous infusion. Circulation. 1998;97(5):473–483. - PubMed
Publication types
MeSH terms
Substances
Grants and funding
LinkOut - more resources
Full Text Sources
Other Literature Sources
