. 2010 Oct 6;29(19):3260-71.
doi: 10.1038/emboj.2010.204. Epub 2010 Aug 31.

A multiprotein complex necessary for both transcription and DNA replication at the β-globin locus

Affiliations

A multiprotein complex necessary for both transcription and DNA replication at the β-globin locus

Subhradip Karmakar et al. EMBO J. .

Abstract

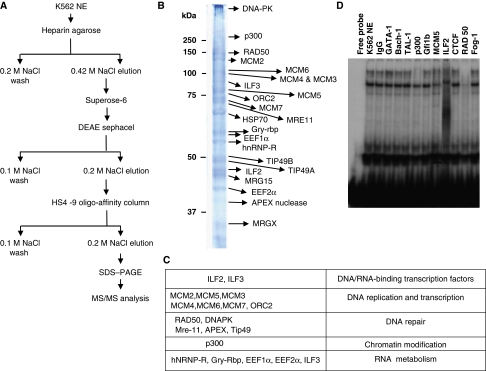
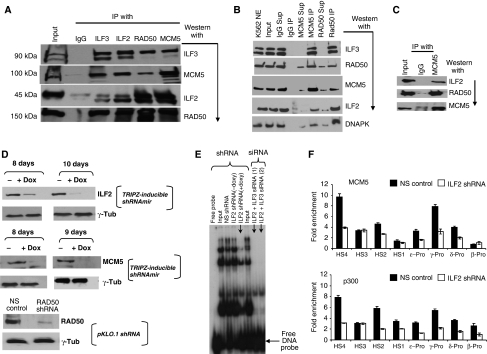
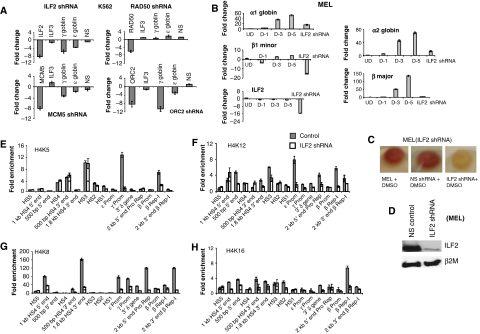
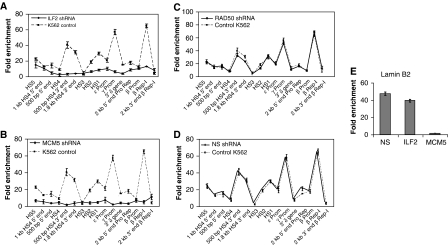
DNA replication, repair, transcription and chromatin structure are intricately associated nuclear processes, but the molecular links between these events are often obscure. In this study, we have surveyed the protein complexes that bind at β-globin locus control region, and purified and characterized the function of one such multiprotein complex from human erythroleukemic K562 cells. We further validated the existence of this complex in human CD34+ cell-derived normal erythroid cells. This complex contains ILF2/ILF3 transcription factors, p300 acetyltransferase and proteins associated with DNA replication, transcription and repair. RNAi knockdown of ILF2, a DNA-binding component of this complex, abrogates the recruitment of the complex to its cognate DNA sequence and inhibits transcription, histone acetylation and usage of the origin of DNA replication at the β-globin locus. These results imply a direct link between mammalian DNA replication, transcription and histone acetylation mediated by a single multiprotein complex.


Conflict of interest statement

The authors declare that they have no conflict of interest.

Figures

Figure 1
Figure 1
Tiling EMSA showing the presence of various DNA–protein complexes recruited to the HS4 region of the β-globin LCR in K562 cells. (A) Architecture of human β-globin cluster showing the DNase-1 hypersensitive sites HS1–5 in the LCR, five β-like-globin genes namely an embryonic ɛ gene (ɛ), two foetal-globin genes (Aγ, Gγ), one pseudogene (ψβ) and two adult-globin genes (β, δ) with the site of origin of DNA replication. (B) Tiling electrophoretic mobility shift assay (EMSA) screen for the detection of K562-specific DNA–protein interactions. The oligonucleotides numbered HS4–1 to HS4–10 at the top of the gel are the overlapping 5′ to 3′ double-stranded oligonucleotide tiles of the 350 bp core HS4 region of the β-globin LCR (see Supplementary data). Ten double-stranded 35-mer (average),32P-labelled oligonucleotide probes covering 350 bp region of the core HS4 were incubated with HeLa or K562 nuclear extracts and run on a 5% native polyacrylamide gel to display gel-retarded bands arising because of binding of K562 or HeLa nuclear proteins to each of the 10 double-stranded oligonucleotides. The EMSA bands were visualized by exposing the radioactive polyacrylamide gel to the photo-film (Kodak). Several common EMSA bands are seen with K562 and HeLa nuclear extracts. The K562-specific EMSA band obtained with HS4–9 oligonucleotide is indicated by an arrow. (C) Size determination of the HS4–9-binding protein complexes by gel exclusion chromatography. Before the size fractionation, the K562 crude nuclear extract was partially purified on a Heparin agarose column. The HS4–9 DNA-binding activity was recovered in the 0.4 M salt elute from the heparin-Sepharose column and was size fractionated by passing through a Superose-6 gel exclusion column. Seventy five 0.3 ml fractions were collected. The void volume of the Superose-6 column is indicated by an arrow. Fractions were assayed for EMSA to detect HS4–9-binding activity. This activity eluted after the void volume and peaked before the 2 MDa standard molecular marker elution peak. The elution peaks for other standard protein molecular weight markers are indicated at the top of the gel. (D) Competitive EMSA assay showing the sequence-specific binding of K562 nuclear proteins to double-stranded HS4–9 oligonucleotide sequences (sequences given in Supplementary data). In a typical competitive EMSA assay, the DNA—protein-binding reaction mixture contained K562 nuclear extract and 32P-labelled HS4–9 oligonucleotide along with 10–100-fold molar excesses of non-radioactive (i) HS4–9, (ii) ɛ-12, (iii) HIF and (iv) scrambled HS4–9 oligonucleotides. The binding mix was run on a native 5% polyacrylamide gel and exposed to photo-film to visualize EMSA bands. The increasing order of 10–100-fold molar excess of non-radioactive oligonucleotides used in the EMSA lanes are indicated at the top of the figure by the expanding triangle height. The HS4–9-associated EMSA activity was efficiently competed only by non-radioactive molar excess of the same HS4–9 oligonucleotide.
Figure 2
Figure 2
Purification of HS4–9 oligonucleotide-binding DARRT complex. (A) Schematic flow diagram showing the strategy for the biochemical purification of the DARRT complex followed by the identification of its protein components by MS/MS analysis. (B) SDS–PAGE display of the proteins eluted from the final HS4–9 oligonucleotide-affinity column. Each band from the gel was excised, and identified by MS/MS. Mass spectrometry identification of proteins was repeated with two different batches of K562 cells with similar results. (C) Functional categorization of the protein components of DARRT identified by MS/MS analysis. Categorizations were made according to the information available in the literature describing the function of these proteins with various DNA/RNA-associated functions. (D) Gel supershift assay using antibodies against some of the HS4–9-binding proteins identified by MS/MS analysis. Note that only the antibodies against DARRT proteins disturb the EMSA bands. Antibodies against other erythroid transcription factors expressed in K562 cells, as well as the normal IgG control, do not affect the EMSA bands, suggesting the specificity of the supershifts. Although antibodies against p300 and RAD50 neutralize the EMSA bands, antibodies against MCM5 and ILF2 showed supershifts.
Figure 3
Figure 3
ChIP qPCR of the DARRT protein components. ChIP-qPCR assays showing the in vivo recruitment of DARRT components at the β-globin locus in (A) K562 and (B) human primary erythroid cells differentiated from human CD34+ cells. Large text letters in each of the eight graphs indicate which antibody was used for that set of chromatin immunoprecipitations. The ChIP, methodology, antibodies and sequences of the primers are presented in the Supplementary data. ChIP-PCR gels showing the relative enrichments are provided as Supplementary Figure 2B. Fold enrichments were calculated relative to an IgG control. Each figure represents the average of three biological replicates and is expressed as mean±s.e.m. The components of DARRT are all most strongly enriched over HS4 in K562 cells. In the primary erythroid cells, the components are also enriched strongly over the previously described β-globin origins of replication (β-Rep-1).
Figure 4
Figure 4
DARRT exists as a single homogeneous multiprotein complex containing the DNA-binding component ILF2. (A) Co-immunoprecipitations (co-IP) of K562 nuclear extracts using antibodies against ILF2, ILF3, MCM5 and RAD50 show that all the tested components of DARRT co-immunoprecipitate from nuclear extracts. Nuclear extracts (150 μg) were immunoprecipitated with 10 μg of antibodies or isotype-specific IgG and western blotting was performed. (B) Co-Immunodepletions of some of the DARRT components showing that components of DARRT are all associated in a single complex in purified DARRT preparations. For each immunodepletion, 3 μg of the purified DARRT complex and 15 μg of each of the antibody and control normal IgG were used. The supernatant and immunoprecipitated material was analysed by western blot using antibodies against various proteins as shown in the figure. (C) The co-IP in primary human erythroid cells showing that DARRT components co-immunoprecipitate in nuclear extracts from normal erythroid cells. (D) Western blots of doxycycline-induced shRNA-mediated knockdown of ILF2 and MCM5 in K562 cells showing >80% reduction of the specific proteins. RAD50 was knocked down with a constitutive shRNA (pKLO.1). (E) EMSA assays with K562 nuclear extracts from normal and shRNA (ILF2) as well as siRNA-based knockdown of ILF2 and ILF3 showing that depletion of ILF2 alone or in combination with ILF3 abolishes the DARRT EMSA band. Double knockdown of ILF2 and ILF3 were performed using two independent siRNA clones (targeting different regions of the template RNA) as indicated in the figure. NS, non-silencing control shRNA. (F) Chromatin immunoprecipitations with antibodies against MCM5 or p300 in ILF2 knockdown cells. The results show that knockdown of ILF2 results in a substantial reduction of MCM5 and p300 binding to HS4 and other regions of the β-globin locus. Solid bars show the ChIP results in K562 cells treated with a non-silencing shRNA and the open bars show the corresponding results in cells with ILF2 knockdown. The fold enrichment in qPCR signal is expressed relative to the signal obtained with normal IgG. Each experiment was the average of three independent biological replicates and expressed as mean±s.e.m.
Figure 5
Figure 5
Effects of ILF2 knockdown on mRNA expression and histone modifications. Reverse transcriptase quantitative PCR of α- and β-like-globin gene expression in normal and ILF2-, MCM5-, RAD50- and ORC2-knocked down K562 cells (A) and ILF2-knocked down MEL cells (B). shRNA expression was induced in the presence of 2 μg/ml of doxycycline for 9 days. After 6 days of doxycline induction, the MEL cells were shifted to shRNA induction medium containing 2 μg/ml of doxycycline and 2% of DMSO. At day 1 (D-1), day 2 (D-2), day 3 (D-3) and day 5 (D-5) of DMSO treatment, total RNA was isolated and subjected to RT–qPCR analysis. Fold change on the y axis is the change in RT–qPCR signal over the normal K562 and uninduced (UD) MEL cells. NS refers to a non-silencing shRNA control. Each RT–qPCR data set was normalized with GAPDH for K562 and β2M (β 2 microglobulin) for MEL cells. The values in each bar diagram are the averages of two independent biological experiments performed in duplicate. (C) Gross effect of ILF2 knockdown on MEL cells differentiated with DMSO treatment for 5 days. Note that ILF2-knocked down MEL cells failed to turn red upon DMSO-induced differentiation. (D) Significant ILF2 knockdown in MEL using a TRIPZ (Open Biosystems)-inducible shRNAmir. (EH) Effect of ILF2 knockdown on the Histone H4 acetylation pattern across the β-globin locus. Antibodies used against each of the four acetylated lysine residues of histone H4 are shown at the top of each diagram. Solid bars represent normal K562 cells and open bars represent ILF2-knocked down cells. Data presented in each bar diagram is the average of two independent biological experiments performed in duplicate and expressed as mean±s.e.m.
Figure 6
Figure 6
Nascent-strand abundance assay for mapping origins of DNA replication. Graphs show the qPCR quantization of nascent strands originating from replicating foci at the β-globin locus. Short nascent single-stranded DNA was isolated as described in Materials and methods. For each qPCR, 3.5 ng of the DNA were used. The primers used for the qPCR are listed in Supplementary data. Fold enrichment shown in the y axis is the PCR signal intensity over the signal from an equal amount of non-replicating DNA obtained from the flow through of a BND-cellulose column. The shRNA construct harbouring K562 cells were grown in the presence of doxycycline for 9 days, at the end of which they were used for the nascent-strand abundance assay. Solid lines in the graph represent ILF2 (A), MCM5 (B), RAD50 (C) and non-silencing (D) shRNA-expressing K562 cells. Non-silencing (NS) shRNA-expressing cells served as negative control, whereas MCM5-knocked down cells as positive control. Graphs with dotted lines represent normal (control) K562 cells. (E) Effect of ILF2 and MCM5 knockdown cells on the origin of DNA replication at lamin-B2 gene. The values in each point in the graphs represent the average of two independent biological experiments performed in duplicates. The results show that knockdown of ILF2 abolishes the signals for DNA origins of replication in the β-globin locus, but not in the lamin-B2 locus.

Similar articles

Cited by

References

    1. Aladjem MI (2004) The mammalian beta globin origin of DNA replication. Front Biosci 9: 2540–2547 - PubMed
    1. Aladjem MI, Rodewald LW, Lin CM, Bowman S, Cimbora DM, Brody LL, Epner EM, Groudine M, Wahl GM (2002) Replication initiation patterns in the beta-globin loci of totipotent and differentiated murine cells: evidence for multiple initiation regions. Mol Cell Biol 22: 442–452 - PMC - PubMed
    1. Bridges BA (2005) Error-prone DNA repair and translesion synthesis: focus on the replication fork. DNA Repair (Amst) 4: 618–619, 634 - PubMed
    1. Buzina A, Aladjem MI, Kolman JL, Wahl GM, Ellis J (2005) Initiation of DNA replication at the human beta-globin 3′ enhancer. Nucleic Acids Res 33: 4412–4424 - PMC - PubMed
    1. Chen J, Kremer CS, Bender TP (2006) The carbonic anhydrase I locus contains a c-Myb target promoter and modulates differentiation of murine erythroleukemia cells. Oncogene 25: 2758–2772 - PubMed

Publication types

MeSH terms