

Dynamics of multicomponent vesicles in a viscous fluid
- PMID: 20808718
- PMCID: PMC2929801
- DOI: 10.1016/j.jcp.2009.09.017
Dynamics of multicomponent vesicles in a viscous fluid
Abstract
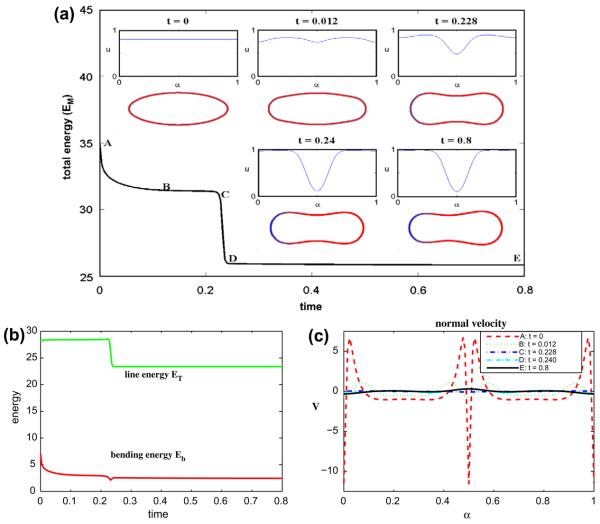
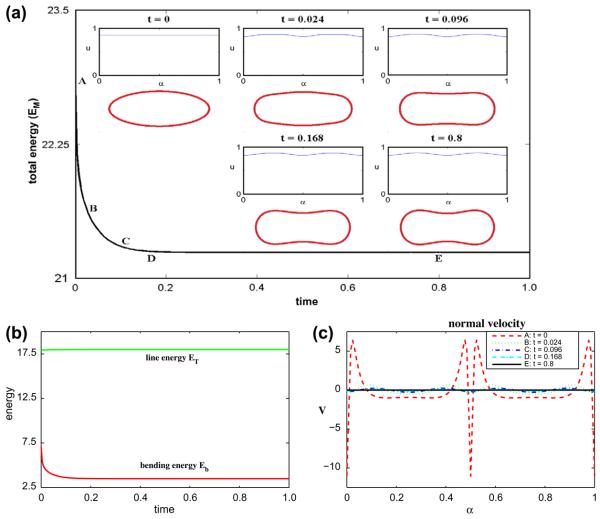
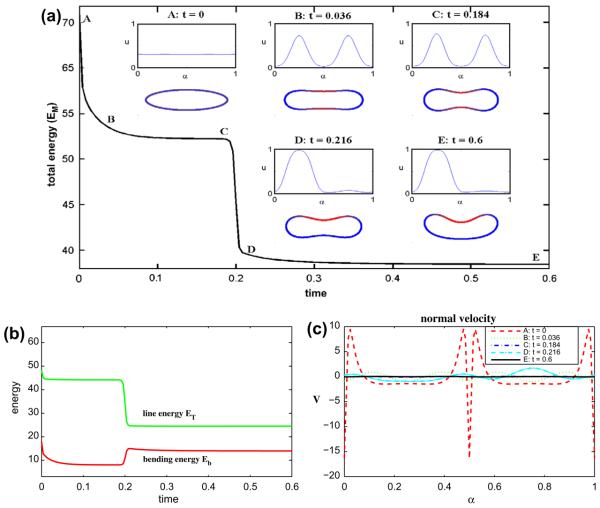
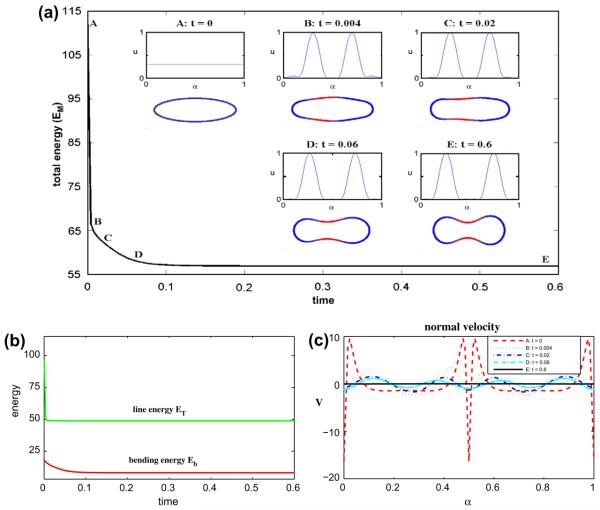
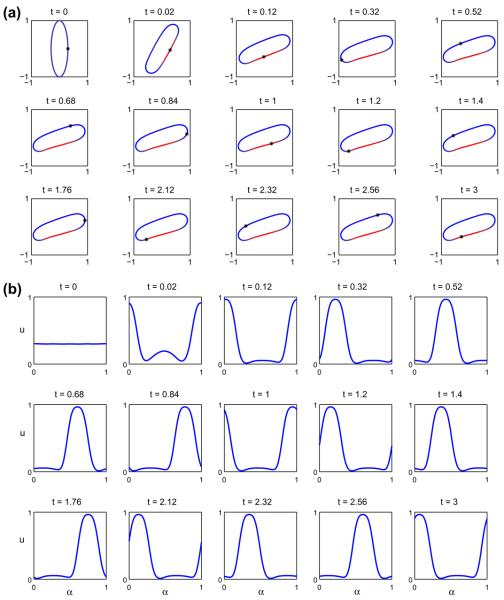
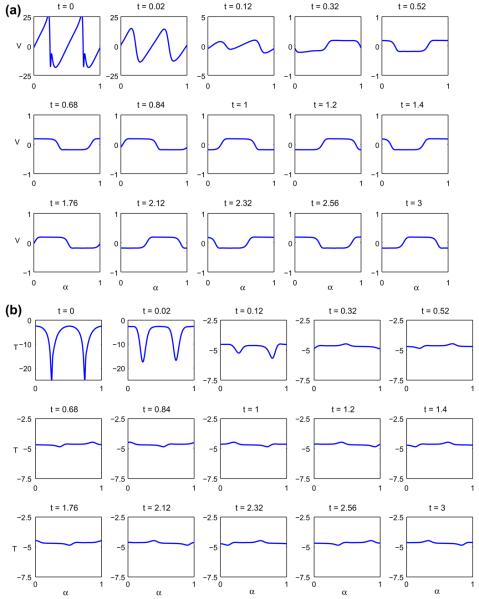
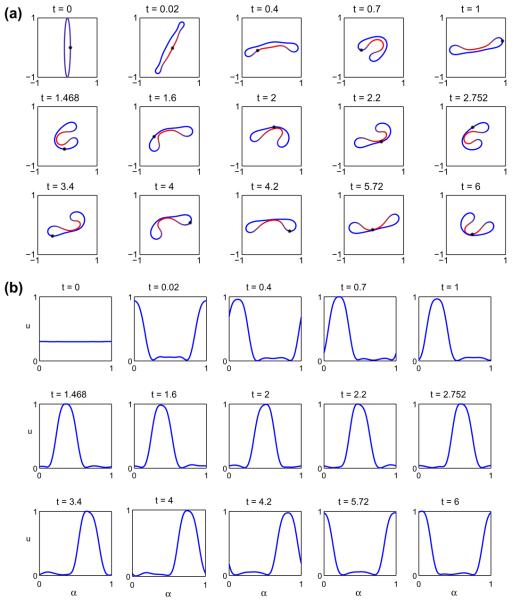
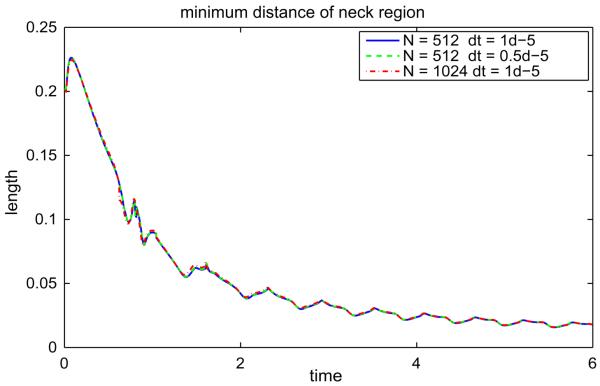
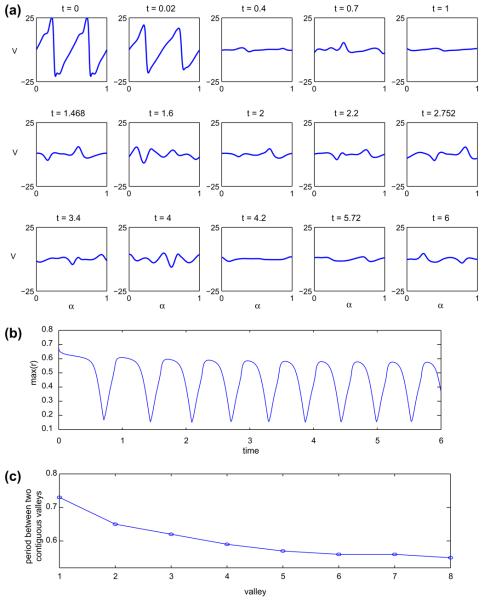
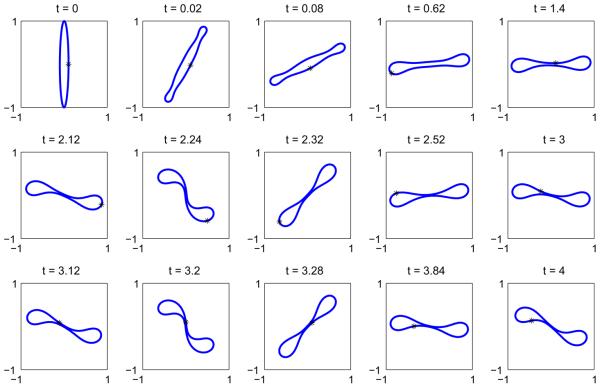
We develop and investigate numerically a thermodynamically consistent model of two-dimensional multicomponent vesicles in an incompressible viscous fluid. The model is derived using an energy variation approach that accounts for different lipid surface phases, the excess energy (line energy) associated with surface phase domain boundaries, bending energy, spontaneous curvature, local inextensibility and fluid flow via the Stokes equations. The equations are high-order (fourth order) nonlinear and nonlocal due to incompressibil-ity of the fluid and the local inextensibility of the vesicle membrane. To solve the equations numerically, we develop a nonstiff, pseudo-spectral boundary integral method that relies on an analysis of the equations at small scales. The algorithm is closely related to that developed very recently by Veerapaneni et al. [81] for homogeneous vesicles although we use a different and more efficient time stepping algorithm and a reformulation of the inextensibility equation. We present simulations of multicomponent vesicles in an initially quiescent fluid and investigate the effect of varying the average surface concentration of an initially unstable mixture of lipid phases. The phases then redistribute and alter the morphology of the vesicle and its dynamics. When an applied shear is introduced, an initially elliptical vesicle tank-treads and attains a steady shape and surface phase distribution. A sufficiently elongated vesicle tumbles and the presence of different surface phases with different bending stiffnesses and spontaneous curvatures yields a complex evolution of the vesicle morphology as the vesicle bends in regions where the bending stiffness and spontaneous curvature are small.
Figures
Similar articles
-
Axisymmetric multicomponent vesicles: A comparison of hydrodynamic and geometric models.Int J Numer Method Biomed Eng. 2012 Mar;28(3):346-68. doi: 10.1002/cnm.2475. Int J Numer Method Biomed Eng. 2012. PMID: 25830201
-
Phase-field modeling of the dynamics of multicomponent vesicles: Spinodal decomposition, coarsening, budding, and fission.Phys Rev E Stat Nonlin Soft Matter Phys. 2009 Mar;79(3 Pt 1):031926. doi: 10.1103/PhysRevE.79.031926. Epub 2009 Mar 31. Phys Rev E Stat Nonlin Soft Matter Phys. 2009. PMID: 19391990 Free PMC article.
-
Dynamics of a multicomponent vesicle in shear flow.Soft Matter. 2017 May 21;13(19):3521-3531. doi: 10.1039/c6sm02452a. Epub 2017 Apr 25. Soft Matter. 2017. PMID: 28440378 Free PMC article.
-
Coupling of bending and stretching deformations in vesicle membranes.Adv Colloid Interface Sci. 2014 Jun;208:14-24. doi: 10.1016/j.cis.2014.02.008. Epub 2014 Feb 18. Adv Colloid Interface Sci. 2014. PMID: 24630342 Review.
-
Giant Vesicles Encapsulating Aqueous Two-Phase Systems: From Phase Diagrams to Membrane Shape Transformations.Front Chem. 2019 Apr 9;7:213. doi: 10.3389/fchem.2019.00213. eCollection 2019. Front Chem. 2019. PMID: 31024898 Free PMC article. Review.
Cited by
-
Signaling networks and cell motility: a computational approach using a phase field description.J Math Biol. 2014 Jul;69(1):91-112. doi: 10.1007/s00285-013-0704-4. Epub 2013 Jul 9. J Math Biol. 2014. PMID: 23835784
-
New Finite Difference Methods Based on IIM for Inextensible Interfaces in Incompressible Flows.East Asian J Applied Math. 2011 Jan 1;1(2):155-171. doi: 10.4208/eajam.030510.250910a. East Asian J Applied Math. 2011. PMID: 23795308 Free PMC article.
-
Particles at fluid-fluid interfaces: A new Navier-Stokes-Cahn-Hilliard surface- phase-field-crystal model.Phys Rev E Stat Nonlin Soft Matter Phys. 2012 Oct;86(4 Pt 2):046321. doi: 10.1103/PhysRevE.86.046321. Epub 2012 Oct 25. Phys Rev E Stat Nonlin Soft Matter Phys. 2012. PMID: 23214691 Free PMC article.
-
Two-phase vesicles: a study on evolutionary and stationary models.Eur Biophys J. 2017 May;46(4):343-350. doi: 10.1007/s00249-016-1177-3. Epub 2016 Sep 23. Eur Biophys J. 2017. PMID: 27664118
-
Continuum- and particle-based modeling of shapes and dynamics of red blood cells in health and disease.Soft Matter. 2013 Jan 7;9(1):28-37. doi: 10.1039/C2SM26891D. Soft Matter. 2013. PMID: 23230450 Free PMC article.
References
-
- Alberts B, Bray D, Lewis J, Raff M, Roberts K, Watson JD. Molecular Biology of the Cell. Garland; New York: 1994.
-
- Allain J-M, Ben Amar M. Biphasic vesicle: instability induced by adsorption of proteins. Phys. Rev. A. 2004;337:531–545.
-
- Allain J-M, Ben Amar M. Budding and fission of a multiphase vesicle. Eur. Phys. J. E. 2006;20:409–420. - PubMed
-
- Andelman D, Kawakatsu T, Kawasaki K. Equilibrium shape of two-component unilamellar membranes and vesicles. Europhys. Lett. 1992;19(1):57–62.
Grants and funding
LinkOut - more resources
Full Text Sources