. 2010 Aug 24;8(8):e1000457.
doi: 10.1371/journal.pbio.1000457.

Tyrosine-phosphorylated caveolin-1 blocks bacterial uptake by inducing Vav2-RhoA-mediated cytoskeletal rearrangements

Affiliations

Tyrosine-phosphorylated caveolin-1 blocks bacterial uptake by inducing Vav2-RhoA-mediated cytoskeletal rearrangements

Jan Peter Boettcher et al. PLoS Biol. .

Abstract

Certain bacterial adhesins appear to promote a pathogen's extracellular lifestyle rather than its entry into host cells. However, little is known about the stimuli elicited upon such pathogen host-cell interactions. Here, we report that type IV pili (Tfp)-producing Neisseria gonorrhoeae (P(+)GC) induces an immediate recruitment of caveolin-1 (Cav1) in the host cell, which subsequently prevents bacterial internalization by triggering cytoskeletal rearrangements via downstream phosphotyrosine signaling. A broad and unbiased analysis of potential interaction partners for tyrosine-phosphorylated Cav1 revealed a direct interaction with the Rho-family guanine nucleotide exchange factor Vav2. Both Vav2 and its substrate, the small GTPase RhoA, were found to play a direct role in the Cav1-mediated prevention of bacterial uptake. Our findings, which have been extended to enteropathogenic Escherichia coli, highlight how Tfp-producing bacteria avoid host cell uptake. Further, our data establish a mechanistic link between Cav1 phosphorylation and pathogen-induced cytoskeleton reorganization and advance our understanding of caveolin function.


Conflict of interest statement

The authors have declared that no competing interests exist.

Figures

Figure 1
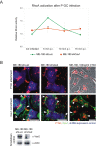
Figure 1. Expression and recruitment of Cav1 prevents internalization of P+GC by host cells.
(A) Recruitment of endogenous Cav1 (white, middle panel) to attached P+GC (green, right panel) in ME-180 cells 2 h post-infection. (B) Excerpts of Movie 1: Cav1-GFP (green) is recruited within seconds to microcolonies and individually attached P+GC (red) in ME-180 cells (lower panels). Recruitment continues as infection proceeds (upper panels). Attached P+GC are indicated by arrows. (C) Knockdown of Cav1 in ME-180 cells and in Cav1 expressing AGS cells (AGS-Cav1) results in P+GC internalization. Cav1 expression was downregulated by transfection of two different siRNAs (Cav1-I or Cav1-II) in ME-180 and AGS-Cav1 cells using lamin A/C as a control siRNA. Gentamicin protection assays were performed 2 h post-infection (upper panel). Experiments were performed in triplicate. Data are mean ± standard deviation. Cav1 knockdown efficiency was confirmed by Western blot analysis (lower panel). (D) shRNA-mediated downregulation of Cav1 in ME-180 cells results in P+GC internalization. Intracellular bacteria (red) are detected in ME-180 shCav1 cells (upper right panels), whereas only extracellular bacteria (yellow-green) are detected in ME-180 shLuciferase control cells (upper left panels). Efficiency of Cav1 knockdown in ME-180 cells after lentiviral transduction of Luciferase (control) or Cav1 shRNA constructs (lower panel). Scale bar: 20 µm. (E) Numbers of viable intracellular P+GC in AGS cells decrease rapidly over time. Infected cells were initially treated with gentamicin for 2 h, then further incubated in gentamicin and serum-free medium and lysed at indicated time points. Experiments were performed in triplicate. Data are mean ± standard deviation.
Figure 2
Figure 2. Tyrosine-phosphorylation of Cav1 is required for Cav1 association with the cytoskeleton and to prevent internalization of P+GC by host cells.
(A) 3D reconstruction of confocal images depicting Cav1-GFP (green) recruitment in the host cell 2 h post-infection with P+GC (red). Gaps between P+GC and Cav1 are indicated by arrows. (B) Horizontal and vertical confocal image sections show F-actin (red) localization between bacteria (blue) and endogenous Cav1 (green) in infected ME-180 cells. Scale bar: 10 µm. (C) Interaction of Cav1 with cytoskeletal components depends on Cav1 phosphorylation. Fractionation of transfected AGS cells reveals a strong association of wild-type Cav1 (Cav1-HA), but not the phosphorylation-deficient mutant (Y14F-Cav1-HA), with cytoskeletal components (lower panel, red marking). Quantification of band intensities revealed a marked decrease (55%) in the association of Y14F-Cav1-HA with the cytoskeleton as compared to Cav1-HA. Endogenous Cav1 also associates with cytoskeletal components in ME-180 cells (lower panel). Cytokeratin 8 serves as a control for the correct localization of cytoskeleton-associated proteins (upper panel). 14-3-3β serves as a control for complete removal of cytoplasm-associated proteins from the cytoskeletal components fraction (middle panel). Full lysate rows serve as loading and protein expression controls. (D) Cav1 phosphorylation during P+GC infection depends on Abl and Src kinases. Western blot analysis of phospho-Tyr14-Cav1 levels (upper panels) and quantification of data (lower panel) show elevated Cav1 phosphorylation starting 5 min after infection. Stimulation of phosphorylation by P+GC is reduced in Src-inhibitor PP2 and Abl-inhibitor STI571-treated cells (both 10 µM). (E) Recruitment of phospho-Tyr14-Cav1 (green, middle panel, white arrows) to attached P+GC (red, right panel) in ME-180 cells 2 h post-infection. Scale bar: 10 µm. (F) Bacterial uptake is observed in Cav1-negative, AGS cells (left panel) but not in wild-type Cav1-transfected AGS cells (middle panel). By contrast, transfection of the phosphorylation-deficient mutant, Y14F-Cav1, does not impede bacterial uptake (right panel). Bacterial infection did not change the localization of Y14F-Cav1 in cells (right panel). Intracellular bacteria appear in red, extracellular bacteria in yellow-green, and Cav1 in blue. Cellular borders are represented as white outlines. Scale bars: 20 µm. Data in A–F are representative of three independent experiments.
Figure 3
Figure 3. Phospho-Tyr14-Cav1 interacts strongly with the Rho-GEF Vav2.
(A) A comprehensive, quantitative screen using microarrays of recombinant human SH2 and PTB domains reveals Tyr14-phosphorylation-dependent binding of Cav1 to several SH2-domain-containing proteins. The RhoA GEF Vav2 shows a high-affinity interaction (K D of 222 nM) with the Tyr14-Cav1 phosphopeptide. The red circle represents the Tyr14-Cav1 phosphopeptide (18 amino acids); the purple circle represents the corresponding non-phosphorylated peptide; green and blue circles represent SH2 and PTB domains, respectively. Green or blue circles outside the rectangle represent tandem domains. The color of lines connecting peptides to domains indicates strength of observed interactions (see legend). K D values for each hit are provided on the legend. (B) Vav2 and PLCγ1 co-precipitate with biotin-labeled Tyr14-Cav1 phosphopeptide. Western blot analysis of streptavidin precipitates of infected and uninfected ME-180 cells using biotin-labeled phosphorylated and non-phosphorylated Tyr14-Cav1 peptides as baits. Vav2 and PLCγ1 are found mainly in precipitates of the phosphorylated peptide. Levels of precipitated Vav2, but not PLCγ1, increase (by 40%) upon infection with P+GC. (C) Co-immunoprecipitation demonstrates increased protein-protein interaction of Cav1 and Vav2 after cell treatment with the phosphotyrosine phosphatase (PTP)-inhibitor pervanadate. Western blot analysis of immunoprecipitates of ME-180 cells using full-length Cav1 protein as bait. Cav1 was immunoprecipitated from untreated (−) and pervanadate-treated cells (+). Precipitates were probed for Cav1, phospho-Tyr14-Cav1, and Vav2. Tyrosine-phosphorylated Cav1 was precipitated exclusively from pervanadate-treated lysates. Levels of co-precipitated Vav2 are markedly increased in pervanadate-treated lysates. (D) GFP-Vav2 and Cav1 interact exclusively after cell treatment with pervanadate. Western blot analysis of total cell lysates (upper panels) and immunoprecipitates (lower panels) using heterologously expressed GFP-Vav2 (construct depicted in Figure S5, upper panel) or GFP protein as baits. Lysates were probed for GFP, Cav1, and phospho-Tyr14-Cav1, respectively. GFP-Vav2 and GFP were immunoprecipitated from untreated (−) and pervanadate-treated cells (+) using a GFP antibody. Precipitates were probed for GFP and phospho-Tyr14-Cav1. Phosphorylated Cav1 was recovered exclusively from pervanadate-treated lysates of GFP-Vav2 expressing cells. (E) Truncated Vav2 and Cav1 interact exclusively after cell treatment with pervanadate. Western blot analysis of ME-180 cell lysates (upper panels) and immunoprecipitates (lower panels) using heterologously expressed truncated Vav2 (construct depicted in Figure S5, lower panel) or FLAG-tag peptide as baits. Truncated Vav2 only possesses the C-terminal SH3-SH2-SH3 domains of Vav2. Using a FLAG antibody, truncated Vav2 was immunoprecipitated from untreated (−) and pervanadate-treated cells (+). Phosphorylated Cav1 was recovered exclusively from lysates of pervanadate-treated truncated Vav2 expressing cells. Data in A–E are representative of three independent experiments.
Figure 4
Figure 4. Vav2 and RhoA prevent internalization of P+GC by host cells.
(A) Knockdown of Vav2 levels in ME-180 cells using siRNA results in P+GC internalization. Intracellular bacteria (red) are detected in siVav2-treated ME-180 cells (upper right panels), whereas only extracellular bacteria (yellow-green) are detected in siLuciferase-treated control cells (upper left panels). Efficiency of Vav2 knockdown in ME-180 cells after siRNA treatment (lower panel). Scale bar: 20 µm. (B) Treatment of ME-180 cells with the membrane-permeable Rho inhibitor CT04 results in P+GC internalization. Intracellular bacteria (red) are detected in CT04-treated ME-180 cells (right panels), whereas only extracellular bacteria (yellow-green) are detected in control-treated ME-180 cells (left panels). Scale bar: 20 µm. (C) Treatment of ME-180 cells with the Rac1 inhibitor NSC23766 does not result in P+GC internalization. Only extracellular bacteria (yellow-green) are detected in 100 µM NSC23766-treated ME-180 cells (right panel) and control-treated ME-180 cells (left panel). Scale bar: 20 µm. Data in A–C are representative of three independent experiments.
Figure 5
Figure 5. Vav2 and RhoA act as downstream signaling partners of Cav1 during P+GC infection.
(A) RhoA activation after P+GC infection depends on Cav1 expression. Levels of the active, GTP-bound state of RhoA are compared between ME-180 shCav1 knockdown cells and ME-180 shLuciferase control cells during an infection time-course. Data are mean ± standard deviation of triplicate wells after normalizing protein levels. RhoA activity was normalized to uninfected ME-180 shLuciferase cells. (B) Cav1 recruitment does not depend on Vav2 expression or RhoA activation. Cav1 (green) recruitment to attached P+GC (red) is observed in ME-180 shLuciferase control cells (blue, upper left panels), ME-180 shVav2 knockdown cells (blue, upper middle panels), and Rho inhibitor CT04-treated ME-180 cells (upper right panels). Recruited Cav1 is indicated by arrows. Efficiency of Vav2 knockdown in ME-180 cells after lentiviral transduction of luciferase (control) or Vav2 shRNA constructs (lower panel). Scale bar: 20 µm. Images are representative of three independent experiments.

References

    1. Gerbase A. C, Rowley J. T, Mertens T. E. Global epidemiology of sexually transmitted diseases. Lancet. 1998;351(Suppl 3):2–4. - PubMed
    1. Merz A. J, So M. Interactions of pathogenic neisseriae with epithelial cell membranes. Annu Rev Cell Dev Biol. 2000;16:423–457. - PubMed
    1. Strom M. S, Lory S. Structure-function and biogenesis of the type IV pili. Annu Rev Microbiol. 1993;47:565–596. - PubMed
    1. Kline K. A, Falker S, Dahlberg S, Normark S, Henriques-Normark B. Bacterial adhesins in host-microbe interactions. Cell Host Microbe. 2009;5:580–592. - PubMed
    1. Mikaty G, Soyer M, Mairey E, Henry N, Dyer D, et al. Extracellular bacterial pathogen induces host cell surface reorganization to resist shear stress. PLoS Pathog. 2009;5:e1000314. doi: 10.1371/journal.ppat.1000314. - DOI - PMC - PubMed

Publication types

MeSH terms