

Identifying molecular effects of diet through systems biology: influence of herring diet on sterol metabolism and protein turnover in mice
- PMID: 20808764
- PMCID: PMC2927425
- DOI: 10.1371/journal.pone.0012361
Identifying molecular effects of diet through systems biology: influence of herring diet on sterol metabolism and protein turnover in mice
Abstract
Background: Changes in lifestyle have resulted in an epidemic development of obesity-related diseases that challenge the healthcare systems worldwide. To develop strategies to tackle this problem the focus is on diet to prevent the development of obesity-associated diseases such as cardiovascular disease (CVD). This will require methods for linking nutrient intake with specific metabolic processes in different tissues.
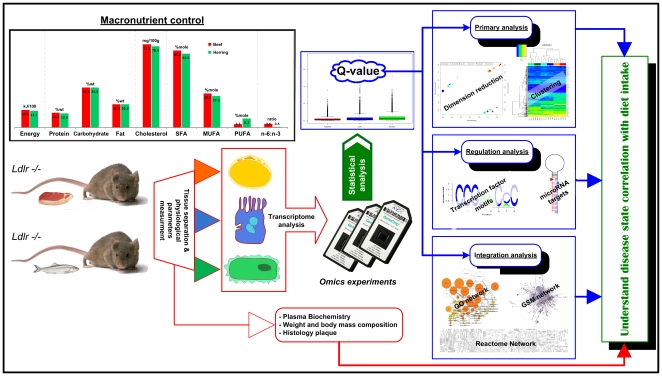
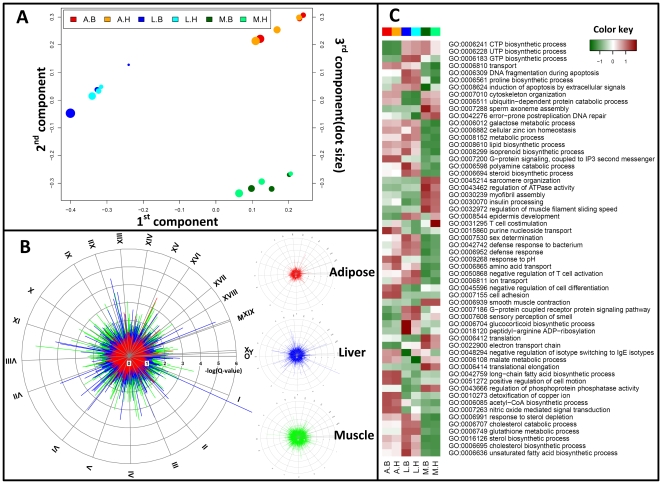
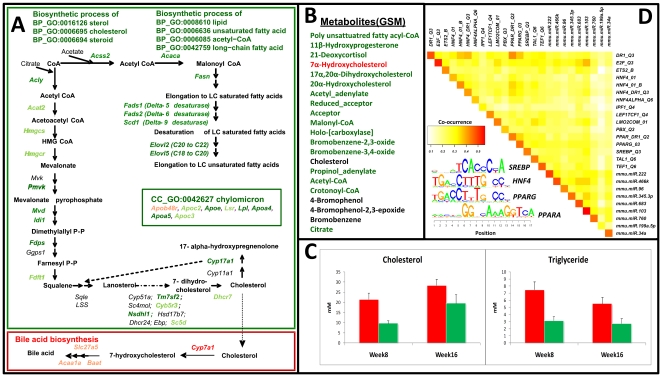
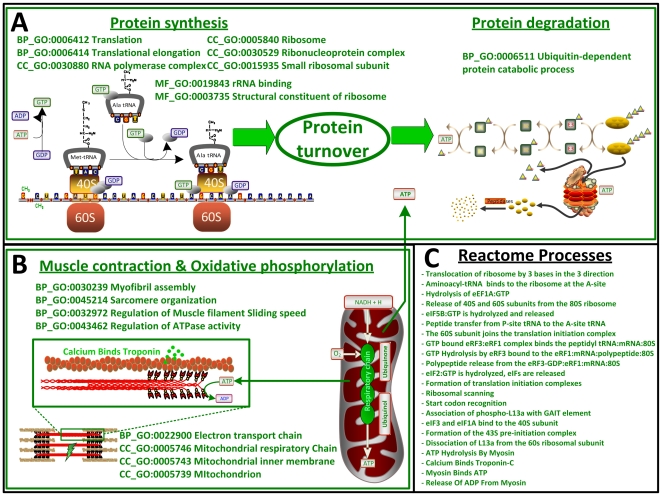
Methodology/principal finding: Low-density lipoprotein receptor-deficient (Ldlr -/-) mice were fed a high fat/high sugar diet to mimic a westernized diet, being a major reason for development of obesity and atherosclerosis. The diets were supplemented with either beef or herring, and matched in macronutrient contents. Body composition, plasma lipids and aortic lesion areas were measured. Transcriptomes of metabolically important tissues, e.g. liver, muscle and adipose tissue were analyzed by an integrated approach with metabolic networks to directly map the metabolic effects of diet in these different tissues. Our analysis revealed a reduction in sterol metabolism and protein turnover at the transcriptional level in herring-fed mice.
Conclusion: This study shows that an integrated analysis of transcriptome data using metabolic networks resulted in the identification of signature pathways. This could not have been achieved using standard clustering methods. In particular, this systems biology analysis could enrich the information content of biomedical or nutritional data where subtle changes in several tissues together affects body metabolism or disease progression. This could be applied to improve diets for subjects exposed to health risks associated with obesity.
Conflict of interest statement
Figures
Similar articles
-
Dietary herring improves plasma lipid profiles and reduces atherosclerosis in obese low-density lipoprotein receptor-deficient mice.Int J Mol Med. 2012 Mar;29(3):331-7. doi: 10.3892/ijmm.2011.856. Epub 2011 Dec 6. Int J Mol Med. 2012. PMID: 22160183
-
A maternal diet of fatty fish reduces body fat of offspring compared with a maternal diet of beef and a post-weaning diet of fish improves insulin sensitivity and lipid profile in adult C57BL/6 male mice.Acta Physiol (Oxf). 2013 Nov;209(3):220-34. doi: 10.1111/apha.12130. Epub 2013 Jun 26. Acta Physiol (Oxf). 2013. PMID: 23746286
-
Influence of herring (Clupea harengus) and herring fractions on metabolic status in rats fed a high energy diet.Acta Physiol (Oxf). 2009 Jul;196(3):303-14. doi: 10.1111/j.1748-1716.2008.01948.x. Epub 2008 Dec 9. Acta Physiol (Oxf). 2009. PMID: 19076113
-
Foodomics as part of the host-microbiota-exposome interplay.J Proteomics. 2016 Sep 16;147:3-20. doi: 10.1016/j.jprot.2016.04.033. Epub 2016 Apr 26. J Proteomics. 2016. PMID: 27130534 Review.
-
Systems biology approaches and pathway tools for investigating cardiovascular disease.Mol Biosyst. 2009 Jun;5(6):588-602. doi: 10.1039/b902356a. Epub 2009 Apr 27. Mol Biosyst. 2009. PMID: 19462016 Review.
Cited by
-
Eicosapentaenoic and docosahexaenoic acid-enriched high fat diet delays the development of fatty liver in mice.Lipids Health Dis. 2015 Jul 22;14:74. doi: 10.1186/s12944-015-0072-8. Lipids Health Dis. 2015. PMID: 26193881 Free PMC article.
-
Unraveling molecular signatures of immunostimulatory adjuvants in the female genital tract through systems biology.PLoS One. 2011;6(6):e20448. doi: 10.1371/journal.pone.0020448. Epub 2011 Jun 7. PLoS One. 2011. PMID: 21666746 Free PMC article.
-
Effects of diets containing fish oils or fish oil concentrates with high cetoleic acid content on the circulating cholesterol concentration in rodents. A systematic review and meta-analysis.Br J Nutr. 2024 Feb 28;131(4):606-621. doi: 10.1017/S0007114523002118. Epub 2023 Sep 22. Br J Nutr. 2024. PMID: 37737066 Free PMC article.
-
Proteomics and systems biology: current and future applications in the nutritional sciences.Adv Nutr. 2011 Jul;2(4):355-64. doi: 10.3945/an.111.000554. Epub 2011 Jun 28. Adv Nutr. 2011. PMID: 22332076 Free PMC article. Review.
-
Dietary supplementation of herring roe and milt enhances hepatic fatty acid catabolism in female mice transgenic for hTNFα.Eur J Nutr. 2012 Sep;51(6):741-53. doi: 10.1007/s00394-011-0254-8. Epub 2011 Oct 11. Eur J Nutr. 2012. PMID: 21986673
References
-
- Ruxton CH, Reed SC, Simpson MJ, Millington KJ. The health benefits of omega-3 polyunsaturated fatty acids: a review of the evidence. J Hum Nutr Diet. 2004;17:449–459. - PubMed
-
- Baur JA, Sinclair DA. Therapeutic potential of resveratrol: the in vivo evidence. Nat Rev Drug Discov. 2006;5:493–506. - PubMed
-
- Muller M, Kersten S. Nutrigenomics: goals and strategies. Nat Rev Genet. 2003;4:315–322. - PubMed
-
- Shlomi T, Cabili MN, Herrgard MJ, Palsson BO, Ruppin E. Network-based prediction of human tissue-specific metabolism. Nat Biotechnol. 2008;26:1003–1010. - PubMed
Publication types
MeSH terms
Substances
LinkOut - more resources
Full Text Sources
Molecular Biology Databases
