. 2010 Aug 23;5(8):e12339.
doi: 10.1371/journal.pone.0012339.

Complex exon-intron marking by histone modifications is not determined solely by nucleosome distribution

Affiliations

Complex exon-intron marking by histone modifications is not determined solely by nucleosome distribution

Pawandeep Dhami et al. PLoS One. .

Abstract

It has recently been shown that nucleosome distribution, histone modifications and RNA polymerase II (Pol II) occupancy show preferential association with exons ("exon-intron marking"), linking chromatin structure and function to co-transcriptional splicing in a variety of eukaryotes. Previous ChIP-sequencing studies suggested that these marking patterns reflect the nucleosomal landscape. By analyzing ChIP-chip datasets across the human genome in three cell types, we have found that this marking system is far more complex than previously observed. We show here that a range of histone modifications and Pol II are preferentially associated with exons. However, there is noticeable cell-type specificity in the degree of exon marking by histone modifications and, surprisingly, this is also reflected in some histone modifications patterns showing biases towards introns. Exon-intron marking is laid down in the absence of transcription on silent genes, with some marking biases changing or becoming reversed for genes expressed at different levels. Furthermore, the relationship of this marking system with splicing is not simple, with only some histone modifications reflecting exon usage/inclusion, while others mirror patterns of exon exclusion. By examining nucleosomal distributions in all three cell types, we demonstrate that these histone modification patterns cannot solely be accounted for by differences in nucleosome levels between exons and introns. In addition, because of inherent differences between ChIP-chip array and ChIP-sequencing approaches, these platforms report different nucleosome distribution patterns across the human genome. Our findings confound existing views and point to active cellular mechanisms which dynamically regulate histone modification levels and account for exon-intron marking. We believe that these histone modification patterns provide links between chromatin accessibility, Pol II movement and co-transcriptional splicing.


Conflict of interest statement

Competing Interests: The authors have declared that no competing interests exist.

Figures

Figure 1
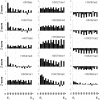
Figure 1. Histone modification patterns track exons and introns across gene bodies which is not accounted for by nucleosome distribution.
Histograms show the mean levels of ChIP-chip enrichments (Z-scores) for 15 histone modifications spanning the first ten exons and nine introns of expressed consensus genes (n = 268, exons∶introns  = 1466∶551). Data is derived from ENCODE regions in the K562 and U937 cell lines and CD14+ primary monocytes. Datasets were normalized with the combined histone distribution profiles obtained for H2B and H3 in each cell line. Some of these modifications showed the most obvious exon marking over the first two 5′ exons (eg., H3K9ac and H3K4me3), while others showed differential enrichments across the majority of the first ten exons (eg., H3K27me1 and H3K36me3), apart from the first two. Repressive modifications H3K9me2/3 and H3K27me2/3 showed preferential depletion of exons, while H3K36me1 showed preferential enrichment of introns. Hypothetical gene structures are shown at the bottom of the figure. Median P-value obtained from bootstrapping for exons and introns across all 19 histone modifications tested in this study was <1.0×10⁻¹⁵. Median P-value obtained for pair-wise t-tests between adjacent exon-intron pairs (exon2 → exon10) for the data shown in the figure was 3.54×10⁻⁵.
Figure 2
Figure 2. Nucleosome distribution patterns in three cell types display different biases with respect to exon-intron structures in gene bodies of expressed genes.
Histograms show the mean levels of ChIP-chip enrichments (Z-scores) or mean number of reads (ChIP-seq) for histones spanning the first ten exons and nine introns of consensus expressed genes. a. K562 cell line using ChIP-chip (n = 76, exons∶introns  = 477∶187). b. U937 cell line using ChIP-chip (n = 88, exons∶introns  = 558∶219). c. CD14+ primary monocytes using ChIP-chip (n = 80, exons∶introns  = 493∶181). d. K562 cell line using ChIP-seq (n = 68, exons∶introns  = 465∶418). e. K562 cell line using ChIP-seq (n = 1184, exons∶introns  = 8095∶7500). Data was derived as the combined dataset for H2B and H3 across the ENCODE regions (panels a → d) or across the whole genome (panel e). Hypothetical gene structures are shown at the bottom of each panel of the figure. Median P-values obtained from bootstrapping for exons and introns were 1.77×10⁻¹³ (panel a), <1.0×10⁻¹⁵ (panel b), 5.93×10⁻¹¹ (panel c), <1.0×10⁻¹⁵ (panel d) and <1.0×10⁻¹⁵ (panel e). Median P-values obtained for pair-wise t-tests between exons and introns (exon2 → exon10) were 4.14×10⁻⁴ (panel a), 1.87×10⁻¹³ (panel b), 2.33×10⁻¹⁶ (panel c), 3.21×10⁻¹⁰ (panel d) and <1.0×10⁻¹⁵ (panel e).
Figure 3
Figure 3. Histone modifications differentially mark canonical and alternatively-spliced exons and introns across bodies of expressed genes.
Histograms show the mean levels (Z-scores) for histone modifications and histones (ChIP-chip enrichments) or chromatin accessibility (FAIRE) spanning typical canonical/alternatively-spliced exons and introns. Data was derived from gene bodies of expressed genes (n = 268, canonical exons:alternatively-spliced exons∶introns  = 2463∶523∶3036) in the K562 and U937 cell lines and CD14+ primary monocytes across the ENCODE regions. Histone distribution was based on the combined data for H2B and H3 in each cell type. Biases favoring either canonical exon or intron are summarized by the difference in Z-scores shown above each assay in grey. Positive (+) differences in Z-scores reflect exon biases, while negative (−) differences reflect intron biases. Error bars are 95% confidence intervals.
Figure 4
Figure 4. RNA polymerase II (Pol II) occupancy levels are increased at transcribed exons.
a. Pol II levels across consensus expressed (“ON”) (n = 245) and non-expressed (“OFF”) genes (n = 115). b. Histograms show levels of Pol II at 5′ ends and across gene bodies with respect to canonical/alternatively-spliced exons and introns of expressed genes [n = 181, canonical exon:alternatively-spliced exon∶intron  = 330∶151∶496 (5′ ends) or 1705/371/2110 (gene bodies)]. Biases favoring either canonical exon or intron are summarized by the difference in Z-scores shown above each assay in grey. Positive (+) differences in Z-scores reflect exon biases, while negative (−) differences reflect intron biases. Error bars are 95% confidence intervals. c. Exon-intron tracking of Pol II across the first ten exons and nine introns of consensus expressed genes (n = 181, exon∶introns  = 980∶376) (hypothetical gene structure shown below panel). d. Exon-intron tracking of Pol II across last 5 exons and 4 introns of consensus expressed genes (n = 181, exon∶introns  = 563∶148) (hypothetical gene structure shown below panel). Median P-values obtained from bootstrapping for exons and introns in c and d were both <1.0×10⁻¹⁵. Median P-values obtained for pair-wise t-tests between adjacent exon-intron pairs in data from c (exon2 → exon10) and in d (exonslast-4 → exonlast) were 5.06×10⁻⁶ and 6.30×10⁻⁴ respectively. In all panels, Pol II ChIP-chip enrichments across ENCODE genes in the K562 and U937 cell lines are expressed as mean Z-scores.
Figure 5
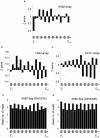
Figure 5. Genome-wide histone modifications patterns track exon-intron structures in gene bodies according to levels of gene expression or repression.
a. Histograms show the level of four histone modifications across the first ten exons and nine introns of consensus genes expressed (“ON”) (n = 1845, exons∶introns  = 12763∶10853) or non-expressed (“OFF”) (n = 1657, exon∶introns  = 10911∶ 9194). Exon numbering is at the bottom of the panel. Median P-value obtained from bootstrapping for exons and introns for all four modifications were <1.0×10⁻¹⁵ (“ON”) and <1.0×10⁻¹⁵ (“OFF”). Median P-values obtained for pair-wise t-tests between adjacent exon-intron pairs (exon2 → exon10) for the data shown in the figure were 1.01×10−49 (“ON”) and 6.48×10−09 (“OFF”). b. Histograms show relationships between four histone modifications and canonical/alternatively-spliced exons, and introns across gene bodies as a function of expression levels (percentile rankings on the x axes). Genes (n = 9921, canonical exons:alternatively-spliced exons∶intron  = 70470∶20733∶91613) were ranked into 12 bins according to expression level (percentile rankings on the x axes). Error bars are 95% confidence intervals. c. Line graphs of the levels of the four histone modifications from b as a function of expression level (percentile rankings on the x axes) and exon/intron structure (red  =  canonical exons, blue  =  alternative exons and green  =  introns). Error bars are 95% confidence levels. In all panels, ChIP-chip enrichments obtained from genome-wide analysis of the K562 cell line are expressed as mean Z-scores.
Figure 6
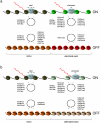
Figure 6. Schematic model of the relationships between histone modifications and exon-intron structures across expressed and non-expressed/silent genes.
Model is based on relationships observed for both ENCODE and whole genome datasets described in the text. Circular arrows reflect statistically significant increases (+) or decreases (−) in histone modification levels (shown either side of the arrows) observed when comparing a typical intron and a typical exon (either canonical or alternative) in either the expressed (“ON”) or non-expressed (“OFF”) state. Relative distances between nucleosomes are based on histone density data. Predicted Pol II movement is also shown. Transcribed mRNA is shown in red. a. Canonical exon versus intron. b. Alternatively-spliced exon versus intron.

Similar articles

Cited by

References

    1. Jenuwein T, Allis CD. Translating the histone code. Science. 2001;293:1074–1080. - PubMed
    1. Barski A, Cuddapah S, Cui K, Roh TY, Schones DE, et al. High-resolution profiling of histone methylations in the human genome. Cell. 2007;129:823–837. - PubMed
    1. Birney E, Stamatoyannopoulos JA, Dutta A, Guigo R, Gingeras TR, et al. Identification and analysis of functional elements in 1% of the human genome by the ENCODE pilot project. Nature. 2007;447:799–816. - PMC - PubMed
    1. Koch CM, Andrews RM, Flicek P, Dillon SC, Karaoz U, et al. The landscape of histone modifications across 1% of the human genome in five human cell lines. Genome Res. 2007;17:691–707. - PMC - PubMed
    1. Wang Z, Zang C, Rosenfeld JA, Schones DE, Barski A, et al. Combinatorial patterns of histone acetylations and methylations in the human genome. Nat Genet. 2008;40:897–903. - PMC - PubMed

Publication types