. 2010 Aug 23;5(8):e12305.
doi: 10.1371/journal.pone.0012305.

Identification of a polycystin-1 cleavage product, P100, that regulates store operated Ca entry through interactions with STIM1

Affiliations

Identification of a polycystin-1 cleavage product, P100, that regulates store operated Ca entry through interactions with STIM1

Owen M Woodward et al. PLoS One. .

Abstract

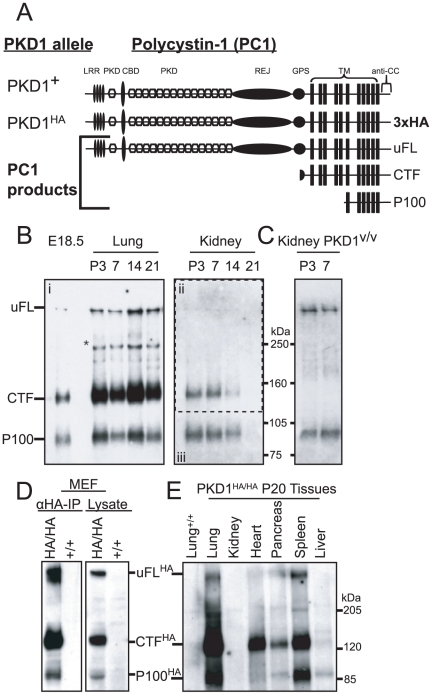
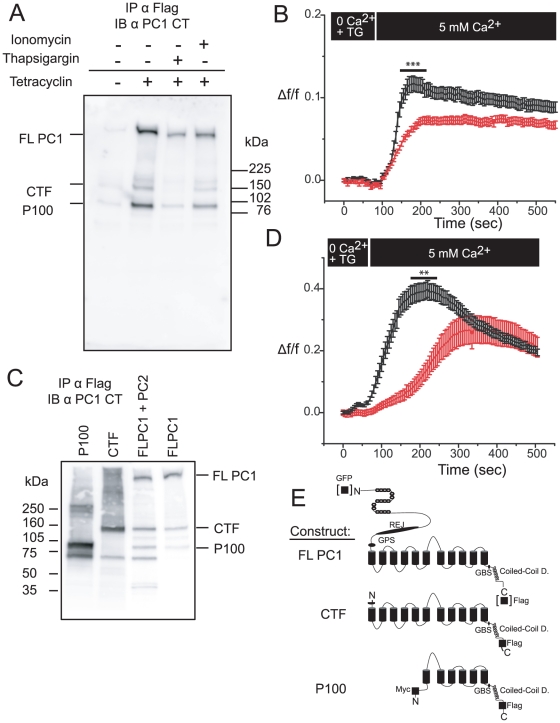
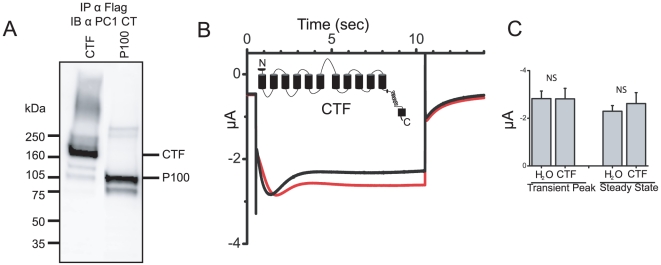
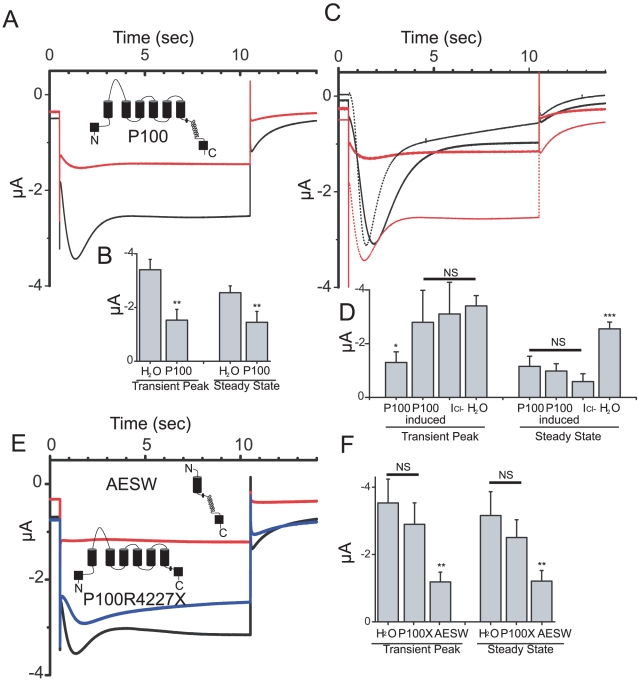
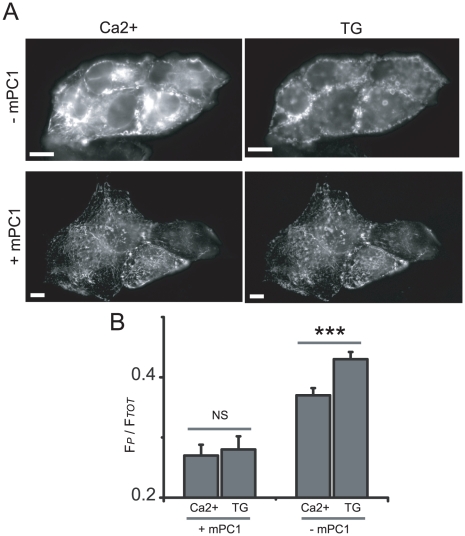
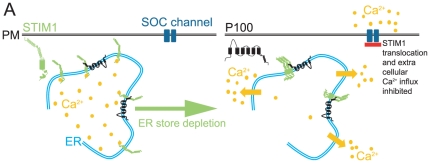
Autosomal Dominant Polycystic Kidney Disease (ADPKD) is a genetic disorder resulting in large kidney cysts and eventual kidney failure. Mutations in either the PKD1 or PKD2/TRPP2 genes and their respective protein products, polycystin-1 (PC1) and polycystin-2 (PC2) result in ADPKD. PC2 is known to function as a non-selective cation channel, but PC1's function and the function of PC1 cleavage products are not well understood. Here we identify an endogenous PC1 cleavage product, P100, a 100 kDa fragment found in both wild type and epitope tagged PKD1 knock-in mice. Expression of full length human PC1 (FL PC1) and the resulting P100 and C-Terminal Fragment (CTF) cleavage products in both MDCK and CHO cells significantly reduces the store operated Ca(2+) entry (SOCE) resulting from thapsigargin induced store depletion. Exploration into the roles of P100 and CTF in SOCE inhibition reveal that P100, when expressed in Xenopus laevis oocytes, directly inhibits the SOCE currents but CTF does not, nor does P100 when containing the disease causing R4227X mutation. Interestingly, we also found that in PC1 expressing MDCK cells, translocation of the ER Ca(2+) sensor protein STIM1 to the cell periphery was significantly altered. In addition, P100 Co-immunoprecipitates with STIM1 but CTF does not. The expression of P100 in CHO cells recapitulates the STIM1 translocation inhibition seen with FL PC1. These data describe a novel polycystin-1 cleavage product, P100, which functions to reduce SOCE via direct inhibition of STIM1 translocation; a function with consequences for ADPKD.


Conflict of interest statement

Competing Interests: The authors have declared that no competing interests exist.

Figures

Figure 1
Figure 1. Biochemical characterization of a novel endogenous polycystin-1 product, P100.
(A) Pkd1 alleles and schematic diagram of their corresponding polycystin-1 proteins. Pkd1HA is a 3xHA-tagged Pkd1 knock-in allele that produces fully functional PC1 protein. The domains in polycystin-1 are shown. Anti-CC is directed to the cytoplasmic C-terminal tail. The position of uncleaved full-length (uFL), the C-terminal (CTF) and the P100 product is schematically shown. (B) Western blots for wild-type embryo (E18.5), lung (Bi), and kidney (Bii and iii) at different postnatal stages as indicated using anti-CC antibodies after immunoprecipitation. Western blot shown in Bii (enclosed by dashed box) originally from Yu et al 2007; © 2007 by The National Academy of Sciences of the USA. The bands corresponding to uFL, CTF and P100 are indicated. * indicates a band of unknown nature in the lung. (C) Western blot for postnatal kidneys from PKD1v/v mice. (D) Western blot from mouse embryonic fibroblasts (MEF) isolated from Pkd1HA/HA and wild-type 11.5 day old embryos using anti-HA antibody after immunoprecipitation or on the whole cell lysate. (E) Western blot for homozygous Pkd1HA/HA tissues at P20 using anti-HA antibody after immunoprecipitation. The lung of the wild-type littermate (+/+) serves as a negative control.
Figure 2
Figure 2. In vitro biochemical and functional characterization of polycystin-1 cleavage products.
(A) Western blot of PC1-flag protein using anti-CT antibody after immunoprecipitation with flag conjugated beads from MDCK cells with stably transfected, tetracycline inducible PC1 expression. PC1 expression reveals three distinct bands: FL PC1, CTF, and P100. Right two lanes: the effect of 24 hours exposure of PC1 expressing cells to either 10 µM ionomycin or 40 nM thapsigargin (overnight). Blots representative of at least 3 experiments. (B) Fura 2-AM measurements of intracellular Ca2+ in either MDCK cells with (red; n = 5 coverslip, 99 cells) or without (black; n = 5 coverslips, 120 cells) tetracycline induced PC1-flag expression. Recordings began after cells reached steady state in a zero Ca2+, 4 µM thapsigargin ringers. The bath was then replaced with a 5 mM Ca2+ bath solution to measure the store operated calcium entry. Maximum SOC amplitudes (Δf/f) were compared (***p<0.001). (C) Western blot of PC1 and recombinant PC1 cleavage product constructs CTF and P100, in CHO cells. Protein was immunoprecipitated with flag conjugated beads then probed with anti-CT antibodies. Blot representative of at least three experiments. (D) Fura 2-AM measurements in CHO cells transiently transfected with GFP-PC1 (red; n = 12 coverslips, 65 cells) or with empty plasmid (black; n = 7 coverslips, 58 cells). Maximum SOC amplitudes (Δf/f) were compared (**p<0.01). (E) Cartoons of different PC1 constructs used in current study: Full length PC1 with either an N-terminus GFP or C-terminus flag tag; CTF construct with C-terminus flag tag; and P100 construct with both N-terminus myc tags and a C-terminus flag tag.
Figure 3
Figure 3. Polycystin-1 product CTF does not inhibit SOCE.
(A) Western blot of PC1 cleavage product constructs P100 and CTF expressed in Xenopus oocytes, immunoprecipitated with flag conjugated beads and probed with anti-CT antibody. (B) Averaged currents elicited by a −120 mV voltage step in H2O injected control oocytes (black trace, n = 20) or from oocytes expressing CTF (red trace, n = 14). (C) Mean current amplitudes at the transient peak and steady state. ±SEM.
Figure 4
Figure 4. Polycystin-1 product P100 inhibits SOCE.
(A) Averaged currents elicited by a −120 mV voltage step in H2O injected control oocytes (black trace, n = 38) or from oocytes expressing P100 (red trace, n = 18). (B) Mean current amplitudes at the transient peak and steady state. ±SEM; (**p<0.01). (C) Averaged currents form P100 injected oocytes (red trace, n = 11), and the same oocytes after three, 2 second, +60 mV pre-pulses (“induced” black trace, n = 11). For comparison the calculated NFA sensitive Cl- current from supplemental Figure S2E (black dotted trace) and the control currents from 4A (red dotted trace) are included. (D) Mean current amplitudes at the transient peak and steady state, including H2O control data from 4A and calculated ICl- from Figure S2E. ±SEM; (***p<0.001)(*p<0.05). (E) Averaged currents in H2O injected control oocytes (black trace, n = 38), oocytes expressing the AESW construct (red trace, n = 18), or oocytes expressing the P100 R4227X construct (blue trace, n = 13). (F) Mean current amplitudes at the transient peak and steady state; P100X is short for P100 R4227X. ±SEM; (**p<0.01).
Figure 5
Figure 5. PC1 inhibits STIM1 translocation after ER Ca2+ depletion.
(A) MDCK cells stably transfected with either mouse PC1 (+mPC1) or an empty vector (-mPC1) and transiently transfected with YFP-STIM1 imaged in 5 mM Ca2+ ringers and again after 15 min in zero Ca2+ with 4 µM thapsigargin. (B) Translocation of the YFP-STIM1 was monitored as the ratio of peripheral YFP signal (FP) to the total YFP signal per cell (FTot). For mPC1 expressing MDCK cells, n = 4 coverslips, 12 cells; for control cells, n = 4 coverslips, 47 cells. Scale bar in images is 20 µM. ±SEM; (***p<0.001).
Figure 6
Figure 6. P100 physically interacts with STIM1.
(A) CHO cells transiently transfected with STIM1 and either P100 or CTF construct; immunoprecipitated with anti-STIM1 antibody, then probed with anti-CT;or immunoprecipitated with flag conjugated beads then probed with the anti-CT antibody to verify transfection of PC1 products. * denotes endogenous STIM1 only. (B) STIM1 expression was verified by probing the same lysate and immunoprecipitate used in A and B with anti-STIM1 antibody. Blots representative of at least 3 experiments. (C) To confirm the pull down of P100 by STIM1, the reverse was attempted, pulling down STIM1 with P100. CHO cells were again transiently transfected with STIM1 and P100 or STIM1 alone. The Flag tagged P100 was immunoprecipitated with flag conjugated beads then probed with anti-STIM1 antibody. The expression of STIM1 was verified by probing the lysate directly with the anti-STIM1 antibody. (D) The expression of P100 was confirmed by probing the lysate and the immunoprecipitate with anti-Flag. Blots representative of at least 3 experiments. (E) CHO cells transfected with YFP-STIM1 and P100 (right) or the empty plasmid (left) and imaged first in a 5 mM Ca2+ bath solution (top) then again after a 10 min incubation in a zero Ca2+ bath with 8 µM thapsigargin (bottom). P100 retards the peripheral YFP puncta formation.
Figure 7
Figure 7. Model of P100 STIM1 interaction in the ER.
(A) When ER Ca2+ stores are full STIM1 has Ca2+ bound and is evenly distributed throughout the endoplasmic reticulum (ER) membrane. Upon ER store depletion, STIM1 may oligomerize but does not translocate to areas of the ER near the plasma membrane (PM) when the polycystin-1 cleavage product P100 is present, inhibiting the activation of store operated Ca2+ (SOC) currents.

References

    1. Wilson PD. Polycystic kidney disease. N Engl J Med. 2004;350:151–164. - PubMed
    1. Sutters M, Germino GG. Autosomal dominant polycystic kidney disease: molecular genetics and pathophysiology. J Lab Clin Med. 2003;141:91–101. - PubMed
    1. Kottgen M. TRPP2 and autosomal dominant polycystic kidney disease. Biochim Biophys Acta. 2007;1772:836–850. - PubMed
    1. Somlo S, Ehrlich B. Human disease: calcium signaling in polycystic kidney disease. Curr Biol. 2001;11:R356–R360. - PubMed
    1. Nauli SM, Alenghat FJ, Luo Y, Williams E, Vassilev P, et al. Polycystins 1 and 2 mediate mechanosensation in the primary cilium of kidney cells. Nat Genet. 2003;33:129–137. - PubMed

Publication types

MeSH terms