

The effects of tertiary and quaternary infections on the epidemiology of dengue
- PMID: 20808806
- PMCID: PMC2925950
- DOI: 10.1371/journal.pone.0012347
The effects of tertiary and quaternary infections on the epidemiology of dengue
Abstract
The epidemiology of dengue is characterised by irregular epidemic outbreaks and desynchronised dynamics of its four co-circulating virus serotypes. Whilst infection by one serotype appears to convey life-long protection to homologous infection, it is believed to be a risk factor for severe disease manifestations upon secondary, heterologous infection due to the phenomenon of Antibody-Dependent Enhancement (ADE). Subsequent clinical infections are rarely reported and, since the majority of dengue infections are generally asymptomatic, it is not clear if and to what degree tertiary or quaternary infections contribute to dengue epidemiology. Here we investigate the effect of third and subsequent infections on the transmission dynamics of dengue and show that although the qualitative patterns are largely equivalent, the system more readily exhibits the desynchronised serotype oscillations and multi-annual epidemic outbreaks upon their inclusion. More importantly, permitting third and fourth infections significantly increases the force of infection without resorting to high basic reproductive numbers. Realistic age-prevalent patterns and seroconversion rates are therefore easier reconciled with a low value of dengue's transmission potential if allowing for more than two infections; this should have important consequences for dengue control and intervention measures.
Conflict of interest statement
Figures
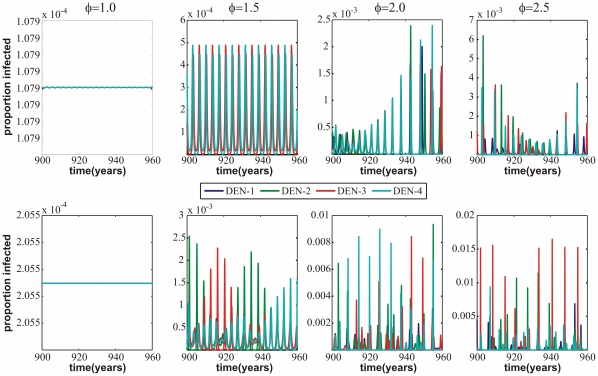
 (from left to right:
  ,
,  ,
,  ,
,  ; no enhancement is represented by
  ; increasing
  corresponds to augmented levels of enhancement). The top panel is for the model with the assumption of total immunity after two infections only (model (i)) whilst the bottom is for the model which allows for infection with all four serotypes (model (ii)). The individual serotype dynamics seem to become ever more desynchronised as
  increases in both models, though this effect appears stronger in model (ii).
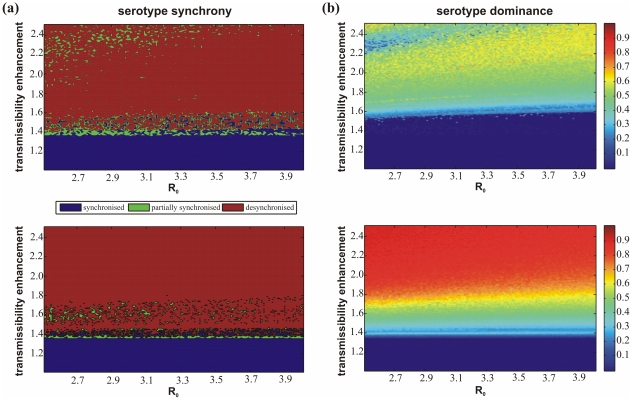
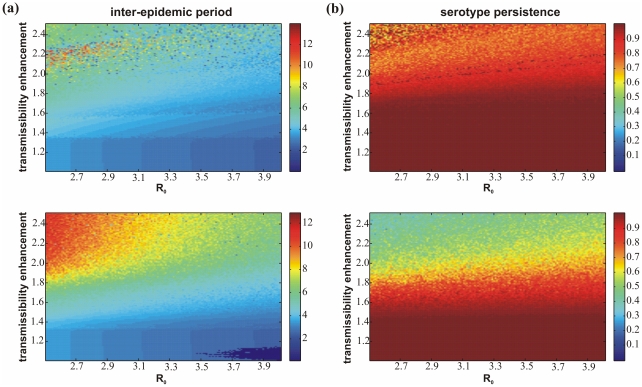
 . However, these trends both appear to be stronger in model (ii). (b) The risk of stochastic extinction within the model is shown as the proportion of time in each model that the prevalence of a particular serotype exists above a specific threshold. In both models there is a low risk of extinction but the risk increases with enhancement; again, this trend is stronger in model (ii).
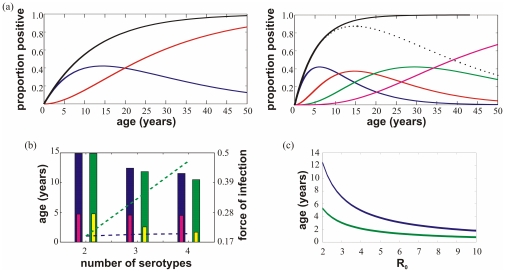
 acts to decrease the average age of first infection (here estimated as 1/total force of infection) and that for all levels of
  this value is significantly lower when allowing for third and fourth infection (model (ii)). Parameter values:
  ((a), (b) and (c)) and
  (a),
(a),  (b).
(b).References
-
- Burke DS, Nisalak A, Johnson DE, Scott RM. A prospective study of dengue infections in Bangkok. Am J Trop Med Hyg. 1988;38:172–180. - PubMed
-
- Halstead SB. In vivo enhancement of Dengue virus infection in rhesus monkeys by passively transferred antibody. J Infect Dis. 1979;140:527–533. - PubMed
-
- Thein S, Aung MM, Shwe TN, Aye M, Zaw A, et al. Risk factors in dengue shock syndrome. Am J Trop Med Hyg. 1997;56:566–572. - PubMed
Publication types
MeSH terms
Grants and funding
LinkOut - more resources
Full Text Sources
Other Literature Sources
