Comparative Study
. 2010 Aug 20;5(8):e12207.
doi: 10.1371/journal.pone.0012207.

PLEKHA7 is an adherens junction protein with a tissue distribution and subcellular localization distinct from ZO-1 and E-cadherin

Affiliations
Comparative Study

PLEKHA7 is an adherens junction protein with a tissue distribution and subcellular localization distinct from ZO-1 and E-cadherin

Pamela Pulimeno et al. PLoS One. .

Abstract

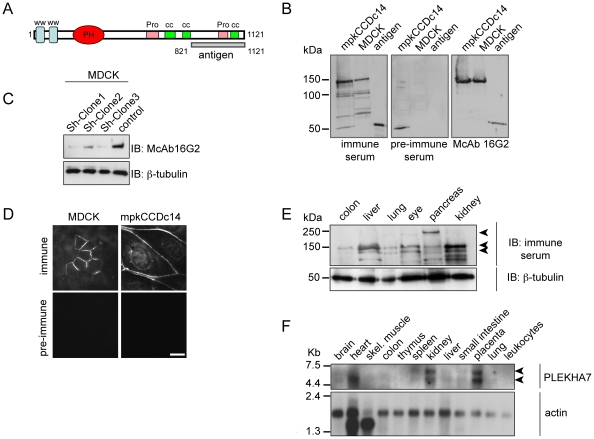
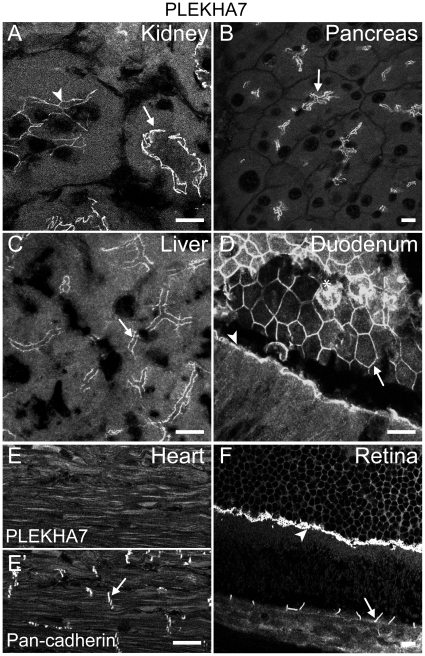
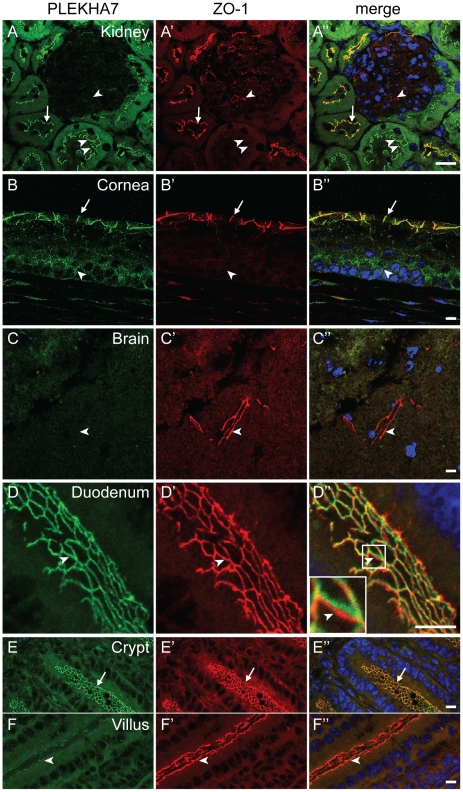
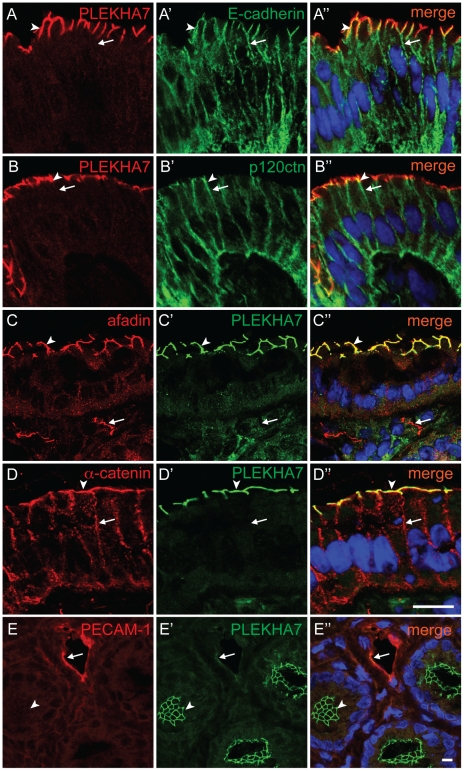
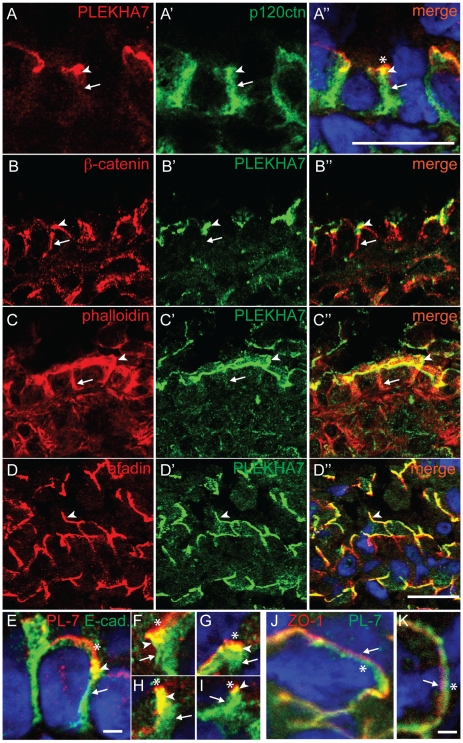
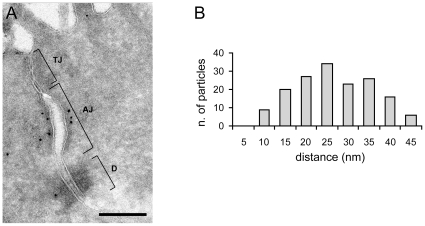
The pleckstrin-homology-domain-containing protein PLEKHA7 was recently identified as a protein linking the E-cadherin-p120 ctn complex to the microtubule cytoskeleton. Here we characterize the expression, tissue distribution and subcellular localization of PLEKHA7 by immunoblotting, immunofluorescence microscopy, immunoelectron microscopy, and northern blotting in mammalian tissues. Anti-PLEKHA7 antibodies label the junctional regions of cultured kidney epithelial cells by immunofluorescence microscopy, and major polypeptides of M(r) approximately 135 kDa and approximately 145 kDa by immunoblotting of lysates of cells and tissues. Two PLEKHA7 transcripts ( approximately 5.5 kb and approximately 6.5 kb) are detected in epithelial tissues. PLEKHA7 is detected at epithelial junctions in sections of kidney, liver, pancreas, intestine, retina, and cornea, and its tissue distribution and subcellular localization are distinct from ZO-1. For example, PLEKHA7 is not detected within kidney glomeruli. Similarly to E-cadherin, p120 ctn, beta-catenin and alpha-catenin, PLEKHA7 is concentrated in the apical junctional belt, but unlike these adherens junction markers, and similarly to afadin, PLEKHA7 is not localized along the lateral region of polarized epithelial cells. Immunoelectron microscopy definitively establishes that PLEKHA7 is localized at the adherens junctions in colonic epithelial cells, at a mean distance of 28 nm from the plasma membrane. In summary, we show that PLEKHA7 is a cytoplasmic component of the epithelial adherens junction belt, with a subcellular localization and tissue distribution that is distinct from that of ZO-1 and most AJ proteins, and we provide the first description of its distribution and localization in several tissues.


Conflict of interest statement

Competing Interests: The authors have declared that no competing interests exist.

Figures

Figure 1
Figure 1. Characterization of anti-PLEKHA7 antibodies, and expression of PLEKHA7 in cells and tissues.
A. Schematic diagram of the domain organization of PLEKHA7, showing WW, pleckstrin-homology (PH), proline-rich (Pro), and coiled-coil (cc) domains. The C-terminal region comprising the sequences of PLEKHA7 used to generate the GST-fusion protein is indicated (antigen, residues 821–1121). B. Immunoblotting analysis of lysates of mouse (mpkCCDc14) and dog (MDCK) renal epithelial cells, and PLEKHA7 antigen (see (A)) using rabbit immune and pre-immune sera, and mouse monoclonal antibody 16G2. A polypeptide of Mr ∼145 kDa and the antigen (∼ 50 kDa) are specifically labeled by both antibodies. In addition, the immune serum labels additional polypeptides of smaller size, which may in part derive from proteolytic degradation of full-length PLEKHA7, and in part from non-specific cross-reaction. Apparent sizes of molecular size markers are indicated (kDa). C. Immunoblotting analysis of lysates of three clonal lines of MDCK cells depleted of PLEKHA7 by shRNA-mediated silencing, using the monoclonal antibody 16G2, or anti-β-tubulin antibodies (to normalize protein loadings). D. Immunofluorescence microscopy analysis of exogenous human PLEKHA7 expressed in canine MDCK cells (left) and endogenous PLEKHA7 in mouse mpkCCDc14 cells (right), using either immune or pre-immune rabbit serum (Bar = 15 µm). Note that by immunofluorescence microscopy the rabbit immune serum does not recognize canine PLEKHA7, but only the exogenously expressed human protein. E. Immunoblotting analysis of PLEKHA7 in lysates of epithelial tissues, using either polyclonal anti-PLEKHA7 immune serum, or anti-β-tubulin antibodies. Arrowheads on the right indicate major polypeptides labeled by the polyclonal antiserum, with apparent sizes of Mr ∼240 kDa, Mr ∼145 kDa, and Mr ∼135 kDa. F. Northern blot analysis of a human multiple tissue array of total RNA, hybridized using specific PLEKHA7 (top panel) and actin (bottom panel) DIG-labelled probes. Arrowheads on the right indicate that PLEKHA7 mRNA is detected as two bands of ∼5.5 kb and ∼6.5 kb.
Figure 2
Figure 2. PLEKHA7 is localized at cell-cell junctions in epithelial tissues.
Immunofluorescent analysis of PLEKHA7 distribution in kidney (A), pancreas (B), liver (C), duodenum (D), heart (E) and retina (F), using polyclonal immune serum, and pan-cadherin distribution in heart (E′). Arrows indicate junctions between epithelial cells, except in E′, where the arrow indicates intercalated disks. The arrowhead in A indicates weaker junctional labeling in a subset of cortical tubules. The arrowhead in D indicates apical staining in longitudinally sectioned columnar epithelial cells. The asterisk in D indicates non-specific labeling of mucus in goblet cells. The arrowhead in F indicates staining in the outer limiting membrane of the retina. Bar = 10 µm.
Figure 3
Figure 3. The localization and distribution of PLEKHA7 and ZO-1 are distinct.
Double immunofluorescence labeling of PLEKHA7 and ZO-1 in mouse kidney cortex (A-A”), cornea (B-B”), brain (C-C”), and duodenum (D-D”, E-E”, F-F”). Arrows indicate junctions where PLEKHA7 and ZO-1 labeling appear co-localized. Arrowheads indicate junctions that show stronger or only labeling for either PLEKHA7 (B-B”) or ZO-1 (A-A”, C-C”, F-F”). Double arrowheads in A-A″ indicate kidney tubules that show weaker ZO-1 labeling. Merge images show nuclei labeled in blue by DAPI. Bar = 10 µm.
Figure 4
Figure 4. PLEKHA7 colocalizes with AJ proteins at the apical AJ belt, but not along the lateral walls.
Double immunofluorescence labeling of sections of intestinal tissue with antibodies against PLEKHA7, together with antibodies against either E-cadherin (A-A”), or p120ctn (B-B″), or afadin (C-C″), or α-catenin (D-D″), or PECAM-1 (E-E″). Arrowheads indicate junctional labeling for PLEKHA7, that is colocalized with the AJ marker (but not in E-E″). Arrows indicate staining of AJ markers along lateral walls (A-A″, B-B″, D-D″). The arrows in C-C″ indicate afadin labeling within the villus stroma (presumably endothelial cells of lymphatic vessels), that is not colocalized with PLEKHA7. Arrows in E-E″ indicate PECAM-1-labeled blood vessels that show very weak PLEKHA7 labeling. Merge images show nuclei labeled in blue by DAPI. Bar = 10 µm.
Figure 5
Figure 5. In bronchial epithelial cells PLEKHA7 colocalizes with AJ proteins, but does not localize along lateral walls.
Double immunofluorescence labeling of PLEKHA7 with p120ctn (A-A”), β-catenin (B-B″), phalloidin (C-C″), afadin (D-D″), E-cadherin (E-I, merge images only), and ZO-1 (J-K, merge images only) in sections of lung (bronchial cells). Arrowheads indicate colocalization between PLEKHA7 and AJ marker. Arrows indicate staining of AJ markers along lateral walls, that is not colocalized with PLEKHA7, except for panels J-K, where arrows indicate apical staining for ZO-1. Asterisks (E-K) indicate PLEKHA7 labeling apical to the region of colocalization with AJ markers at the AJ belt (E-I), and that is spatially distinct from ZO-1 (J-K). Merge images show nuclei labeled in blue by DAPI. Bar = 10 µm (A-D) and 0.5 µm (E-K).
Figure 6
Figure 6. Ultrastructural localization of PLEKHA7 at AJ.
(A) Immuno-gold electron microscopy localization of PLEKHA7 in mouse colon epithelial cells. Tight junction (TJ), adherens junction (AJ) and desmosome (D) are indicated with brackets. Note the accumulation of particles at the AJ. Bar = 300 nm. (B) Histogram showing the distribution of immuno-gold particles associated with the AJ, as a function of the distance from the plasma membrane (nm).

References

    1. Farquhar MG, Palade GE. Junctional complexes in various epithelia. J Cell Biol. 1963;17:375–412. - PMC - PubMed
    1. Shin K, Fogg VC, Margolis B. Tight junctions and cell polarity. Annu Rev Cell Dev Biol. 2006;22:207–235. - PubMed
    1. Gumbiner BM. Cell adhesion: the molecular basis of tissue architecture and morphogenesis. Cell. 1996;84:345–357. - PubMed
    1. Mitic LL, Anderson JM. Molecular architecture of tight junctions. Annu Rev Physiol. 1998;60:121–142. - PubMed
    1. Guillemot L, Paschoud S, Pulimeno P, Foglia A, Citi S. The cytoplasmic plaque of tight junctions: A scaffolding and signalling center. Biochim Biophys Acta. 2008;1778:601–613. - PubMed

Publication types

MeSH terms

LinkOut - more resources