. 2010 Aug 20;5(8):e12303.
doi: 10.1371/journal.pone.0012303.

Transmission of single HIV-1 genomes and dynamics of early immune escape revealed by ultra-deep sequencing

Affiliations

Transmission of single HIV-1 genomes and dynamics of early immune escape revealed by ultra-deep sequencing

Will Fischer et al. PLoS One. .

Abstract

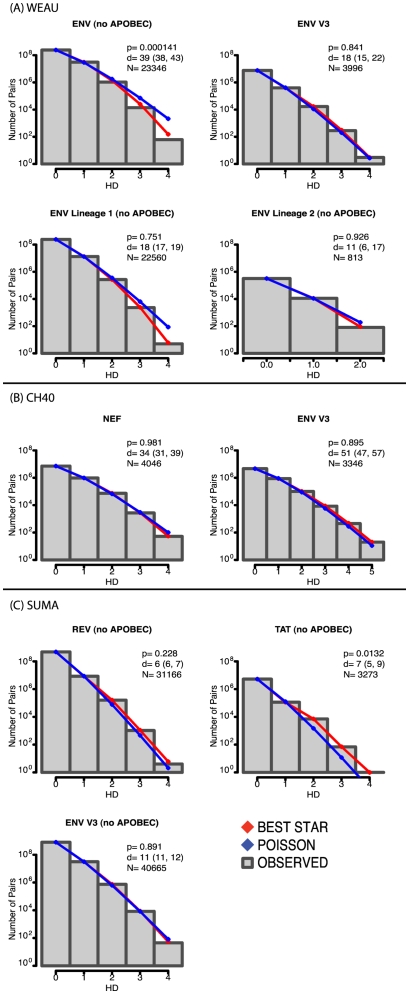
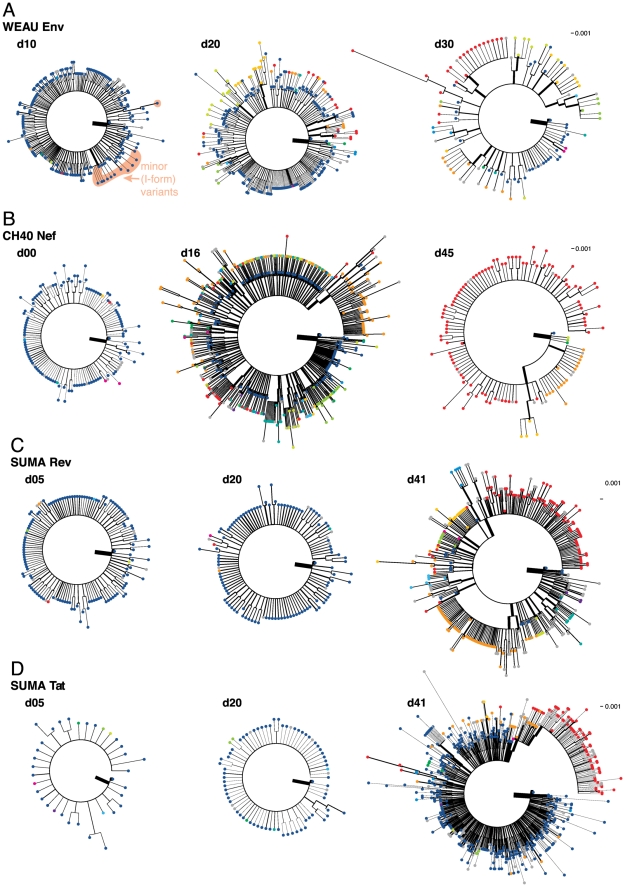
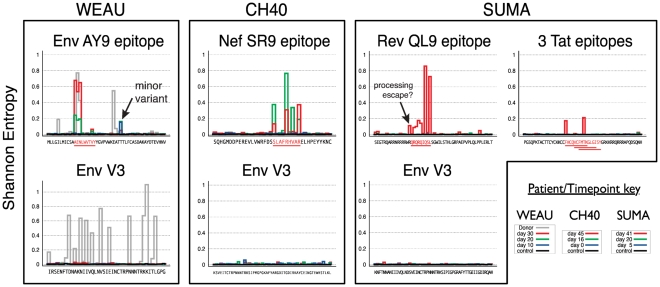
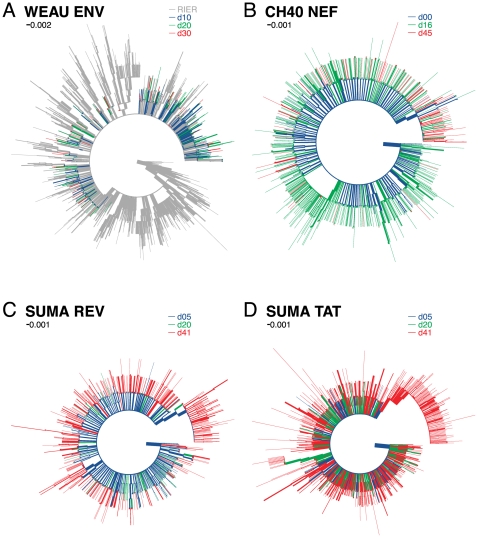
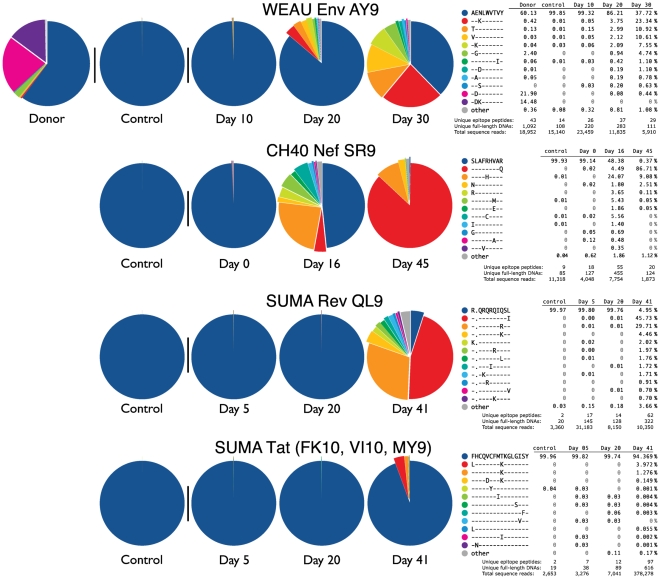
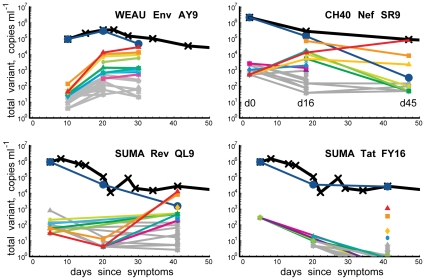
We used ultra-deep sequencing to obtain tens of thousands of HIV-1 sequences from regions targeted by CD8+ T lymphocytes from longitudinal samples from three acutely infected subjects, and modeled viral evolution during the critical first weeks of infection. Previous studies suggested that a single virus established productive infection, but these conclusions were tempered because of limited sampling; now, we have greatly increased our confidence in this observation through modeling the observed earliest sample diversity based on vastly more extensive sampling. Conventional sequencing of HIV-1 from acute/early infection has shown different patterns of escape at different epitopes; we investigated the earliest escapes in exquisite detail. Over 3-6 weeks, ultradeep sequencing revealed that the virus explored an extraordinary array of potential escape routes in the process of evading the earliest CD8 T-lymphocyte responses--using 454 sequencing, we identified over 50 variant forms of each targeted epitope during early immune escape, while only 2-7 variants were detected in the same samples via conventional sequencing. In contrast to the diversity seen within epitopes, non-epitope regions, including the Envelope V3 region, which was sequenced as a control in each subject, displayed very low levels of variation. In early infection, in the regions sequenced, the consensus forms did not have a fitness advantage large enough to trigger reversion to consensus amino acids in the absence of immune pressure. In one subject, a genetic bottleneck was observed, with extensive diversity at the second time point narrowing to two dominant escape forms by the third time point, all within two months of infection. Traces of immune escape were observed in the earliest samples, suggesting that immune pressure is present and effective earlier than previously reported; quantifying the loss rate of the founder virus suggests a direct role for CD8 T-lymphocyte responses in viral containment after peak viremia. Dramatic shifts in the frequencies of epitope variants during the first weeks of infection revealed a complex interplay between viral fitness and immune escape.


Conflict of interest statement

Competing Interests: The authors have declared that no competing interests exist.

Figures

Figure 1
Figure 1. Histogram of pairwise Hamming distance (HD) frequency counts from the earliest samples compared to model predictions.
The red line represents expected counts if the sample followed a star-like phylogeny; the blue line represents the expected counts of the best-fitting Poisson distribution. Goodness of fit p-values (p) (low p-values indicate a statistically significant divergence from a Poisson distribution), estimated days since the most recent common ancestor (d) (95% confidence interval in parentheses), and the number of sequences analyzed (N) are noted in legend (see also Table 1). As we observed previously, for individuals with HIV sequences with increased apobec-context G-to-A mutations , , columns containing apobec-context G-residues must be eliminated for the data to fit a Poisson. A) Subject WEAU: the ENV V3 region (top right) does not diverge significantly from a Poisson distribution; when the ENV epitope region are analyzed all together, they diverge from a Poisson (top left), but can be split into two Poisson-consistent lineages (bottom). B) subject CH40: both the NEF epitope region (left) and ENV V3 region (right) are consistent with a Poisson. C) subject SUMA: the REV epitope and ENV V3 regions (left) were consistent with a Poisson model, but the TAT epitope was not (see text). Additional details regarding the modeling are provided in Table S4.
Figure 2
Figure 2. Maximum Likelihood Phylogenies from DNA sequences of epitope regions.
(A) WEAU env, (B) CH40 nef, (C) SUMA rev, and (D) SUMA tat. Separate trees represent sample time points. Circles at terminal nodes represent epitope variants (colors as in Fig. 5). Trees are rooted on the transmitted variant. Branch widths are proportional to the log of variant frequency; sequences identical to an ancestral node have a negligible non-zero branch-length provided to display frequency.
Figure 3
Figure 3. Site-by-site entropy values for inferred protein sequences.
Defined epitopes are in red and underlined. Shannon entropy values are distinctly elevated in epitope regions. The position of the WEAU Env minor “I-form” variant (see text) is indicated (arrow). SUMA Rev sequences include one additional position with increased entropy, immediately to the left (5′) of the epitope (arrow), which is likely to be a processing mutation.
Figure 4
Figure 4. Maximum likelihood phylogenetic trees including all three time points for each subject.
(A) WEAU and RIER Env, (B) CH40 Nef, (C) SUMA Rev, and (D) SUMA Tat. First time-point variants (blue), second, green; third, red; RIER (WEAU's partner and source of infection), gray. The tree in (A) is rooted on a non-transmitted variant in RIER; the other 3 trees are rooted by transmitted variant.
Figure 5
Figure 5. Epitope variant frequencies.
Epitopes are organized as follows: inferred infective sequence (deep blue), the most common variant at the final time-point (red), and all of the 12 most common variants sorted and colored by their frequency at the last time-point.
Figure 6
Figure 6. Viral dynamics: Variant counts in relation to viral load.
Total numbers of viral variants per ml, estimated from 454 read frequencies and viral load. Viral load in black, measurement dates indicated. Solid blue lines denote transmitted virus; epitope colors match Fig. 5.
Figure 7
Figure 7. Viral dynamics: Estimated accumulation rates of most−common variants.
Estimated growth rates of most-common variants. Colors match Fig. 5; black diamonds denote founder-sequence frequency previously measured by SGA ; horizontal bars, 95% confidence-intervals; and formula image
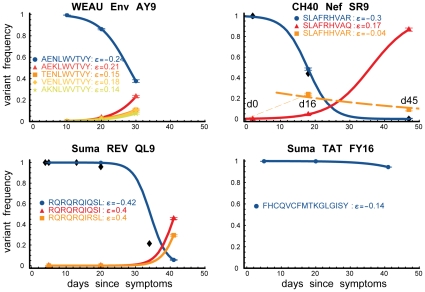
, the rate of accumulation of variants. The dashed line in CH40 denotes accumulation of the SLAFHHVAR in the first 2 weeks of the infection (estimated minimal escape rate, formula image = 0.44 day−1, doubling time 1.6 days). Our previous SGA-sequence-derived estimates of the founder sequence loss rate were lower, 0.13 day−1 (doubling time 5.3 days) and 0.10 day−1 (doubling time 6.9 days) for WEAU Env AY9 and SUMA TAT epitopes, respectively .
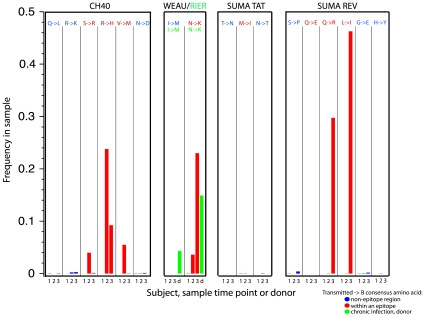
Figure 8
Figure 8. Comparison of consensus frequencies inside and outside of epitopes.
Changes to consensus were much more frequent inside epitopes, and presumably these were rapidly selected for immune escape in part because they were relatively fit. Reversion to the consensus amino acids outside of the epitopes was never observed on the time scale studied here, but consensus forms were common by the time the subjects had reached chronic infection (RIER, shown here in green).

References

    1. Mansky LM, Temin HM. Lower in vivo mutation rate of human immunodeficiency virus type 1 than that predicted from the fidelity of purified reverse transcriptase. J Virol. 1995;69:5087–94. - PMC - PubMed
    1. Perelson AS, Neumann AU, Markowitz M, Leonard JM, Ho DD. HIV-1 dynamics in vivo: virion clearance rate, infected cell life-span, and viral generation time. Science. 1996;271:1582–6. - PubMed
    1. Borrow P, Lewicki H, Wei X, Horwitz MS, Peffer N, et al. Antiviral pressure exerted by HIV-1-specific cytotoxic T lymphocytes (CTLs) during primary infection demonstrated by rapid selection of CTL escape virus. Nat Med. 1997;3:205–11. - PubMed
    1. Goonetilleke N, Liu MK, Salazar-Gonzalez JF, Ferrari G, Giorgi E, et al. The first T cell response to transmitted/founder virus contributes to the control of acute viremia in HIV-1 infection. J Exp Med. 2009;206:1253–72. - PMC - PubMed
    1. Jones NA, Wei X, Flower DR, Wong M, Michor F, et al. Determinants of human immunodeficiency virus type 1 escape from the primary CD8+ cytotoxic T lymphocyte response. J Exp Med. 2004;200:1243–56. - PMC - PubMed

Publication types