. 2010 Aug 20;5(8):e12304.
doi: 10.1371/journal.pone.0012304.

Calcium-activated potassium channels BK and IK1 are functionally expressed in human gliomas but do not regulate cell proliferation

Affiliations

Calcium-activated potassium channels BK and IK1 are functionally expressed in human gliomas but do not regulate cell proliferation

Iskandar F Abdullaev et al. PLoS One. .

Abstract

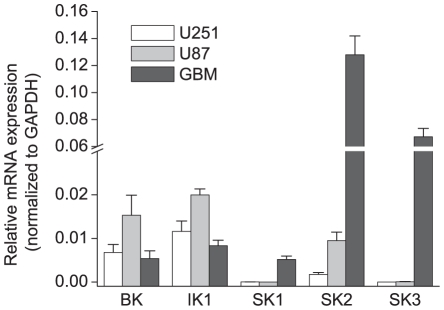
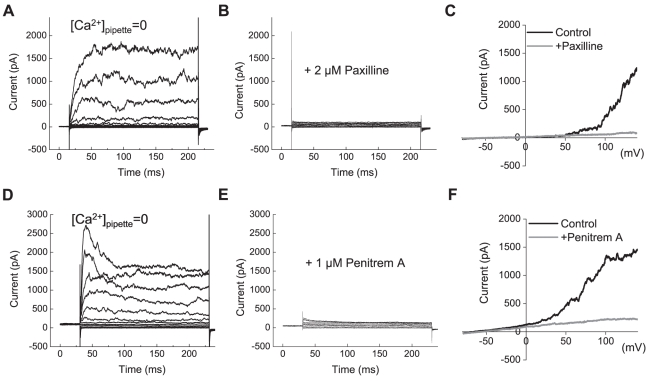
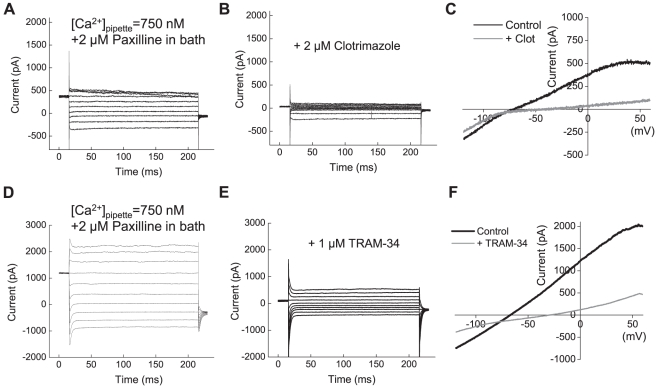
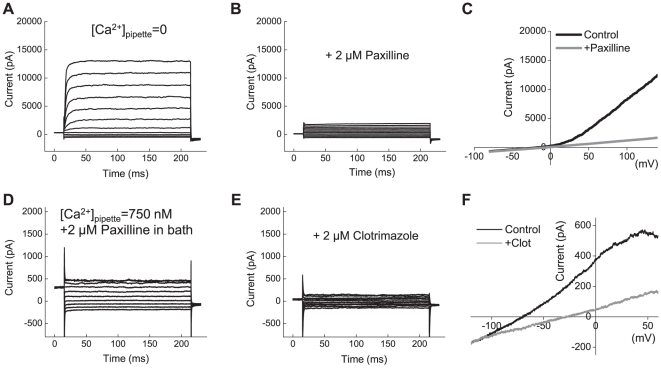
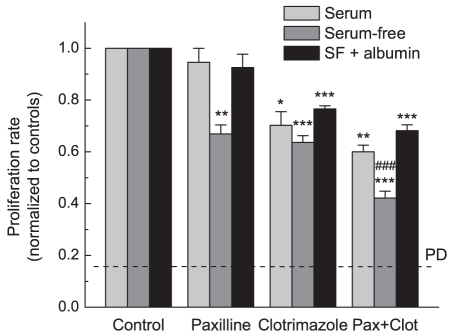
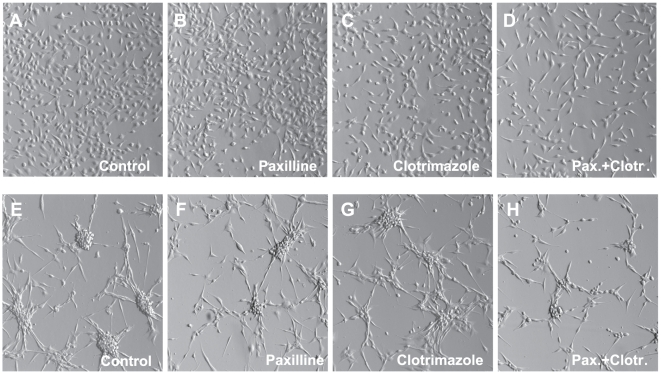
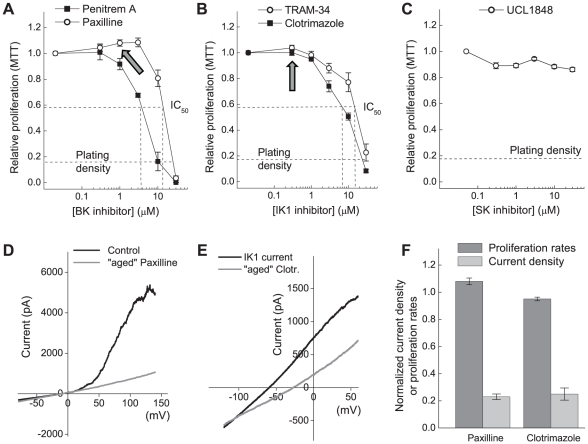
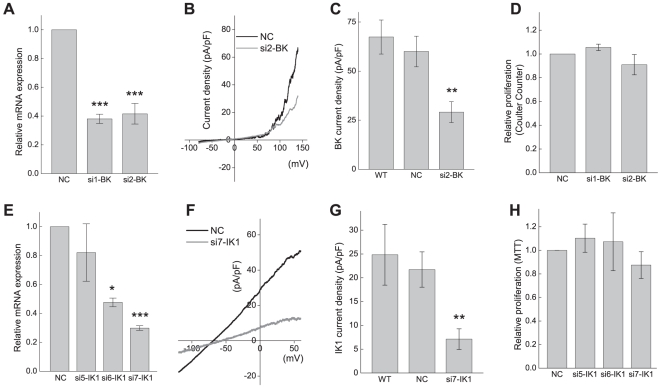
Gliomas are morbid brain tumors that are extremely resistant to available chemotherapy and radiology treatments. Some studies have suggested that calcium-activated potassium channels contribute to the high proliferative potential of tumor cells, including gliomas. However, other publications demonstrated no role for these channels or even assigned them antitumorogenic properties. In this work we characterized the expression and functional contribution to proliferation of Ca(2+)-activated K(+) channels in human glioblastoma cells. Quantitative RT-PCR detected transcripts for the big conductance (BK), intermediate conductance (IK1), and small conductance (SK2) K(+) channels in two glioblastoma-derived cell lines and a surgical sample of glioblastoma multiforme. Functional expression of BK and IK1 in U251 and U87 glioma cell lines and primary glioma cultures was verified using whole-cell electrophysiological recordings. Inhibitors of BK (paxilline and penitrem A) and IK1 channels (clotrimazole and TRAM-34) reduced U251 and U87 proliferation in an additive fashion, while the selective blocker of SK channels UCL1848 had no effect. However, the antiproliferative properties of BK and IK1 inhibitors were seen at concentrations that were higher than those necessary to inhibit channel activity. To verify specificity of pharmacological agents, we downregulated BK and IK1 channels in U251 cells using gene-specific siRNAs. Although siRNA knockdowns caused strong reductions in the BK and IK1 current densities, neither single nor double gene silencing significantly affected rates of proliferation. Taken together, these results suggest that Ca(2+)-activated K(+) channels do not play a critical role in proliferation of glioma cells and that the effects of pharmacological inhibitors occur through their off-target actions.


Conflict of interest statement

Competing Interests: The authors have declared that no competing interests exist.

Figures

Figure 1
Figure 1. mRNA expression of Ca2+-activated K+ channels in human gliomas cell lines and in tissue sample of glioblastoma multiforme.
Relative levels of mRNA expression for BK, IK1 and SK1-3 channels were quantified in U251, U87, and a GBM tissue sample using reverse transcription quantitative PCR. Expression levels were normalized to the expression of two housekeeping genes, GAPDH (shown in graph) and ribosomal protein RPL13A. Mean values ±SE of gene expression in three independent cell preparations for U251 and U81, and three independent measurements for GBM are shown.
Figure 2
Figure 2. BK channels are functionally expressed in U251 glioma cells.
(A) Representative recordings of the whole-cell BK currents elicited by depolarization step pulses from −80 mV to +140 mV in 20 mV intervals. To prevent concomitant activation of IK1 and SK channels, no Ca2+ was added into pipette solution. (B) In the same cell shown in (A), whole-cell K+ currents were potently suppressed by the specific inhibitor of BK channels paxilline (2 µM). (C) Whole cell BK currents in response to depolarization ramps from −80 mV to +140 mV. Representative traces in the absence or presence of paxilline are shown. (D–F) Results of similar experiments employing another selective BK blocker penitrem A (1 µM).
Figure 3
Figure 3. IK1 channels are functionally expressed in U251 glioma cells.
(A) Representative recordings of the whole-cell IK1 currents elicited by depolarization step pulses from −120 mV to +80 mV in 20 mV intervals. Whole cell IK1 currents were activated by clamping pipette [Ca2+] at 750 nM. To prevent concomitant activation of BK currents, 2 µM paxilline was added into bath solution. (B) In the same cell shown in (A), the whole cell IK1 currents were inhibited by the potent IK1 blocker clotrimazole (2 µM). (C) Whole cell currents in response to depolarization ramps from −120 mV to +80 mV in the absence or presence of clotrimazole. (D–F) Results of similar experiments employing the selective IK1 blocker TRAM-34 (1 µM).
Figure 4
Figure 4. Functional expression of BK and IK1 channels in primary cells derived from glioblastoma multiforme (GBM).
(A) Representative recordings of macroscopic BK currents in primary cells cultured from surgical sample of glioblastoma multiforme. Currents were elicited by step pulses from −80 mV to +140 mV. (B) In the same cell shown in (A), the BK blocker paxilline (2 µM) potently inhibited macroscopic K+ currents. (C) Representative traces of K+ currents elicited in response to depolarization ramps from −80 mV to +140 mV in the absence and presence of paxilline. (D) Representative recordings of the whole-cell IK1 currents activated by step pulses from −120 to +60 mV. To isolate IK1 currents, [Ca2+]pipette was clamped at 750 nM and 2 µM paxilline was added into bath solution. (E) The specific IK1 inhibitor clotrimazole (2 µM) potently suppressed macroscopic K+ currents. (F) Representative traces of K+ currents elicited in response to depolarization ramps −120 mV to +60 mV in the absence and presence of clotrimazole. For additional experimental details, see legend to Fig. 2 and Results section.
Figure 5
Figure 5. Effects of the BK blocker paxilline and the IK blocker clotrimazole on U251 cell proliferation in serum-containing and serum-free media.
Paxilline (10 µM) and clotrimazole (10 µM) were added to culture media alone or in combination, and rates of cell proliferation were determined 48 hrs later using an MTT proliferation assay. Proliferation assays were performed in standard cell culture medium (DMEM +10% FBS), serum-free OptiMEM medium supplemented with serum substitute B27, or in OptiMEM+B27 additionally containing bovine serum albumin (2 mg/ml). Quantitatively similar data were obtained using Coulter counter assay (see Fig. S2). *, p<0.05, **p<0.01, ***p<0.001 vs. control; ##p<0.01, combination of drugs vs. paxilline or clotrimazole alone.
Figure 6
Figure 6. Representative micrographs of U251 (A-D) and U87 (E-H) cells grown in the presence of BK and IK1 blockers.
Cells were grown in the serum-free OptiMEM media supplemented with serum substitute B27. The BK blocker paxilline (10 µM) and the IK1 inhibitor clotrimazole (10 µM) were added as indicated. Images of the cells were captured ∼48 hrs after addition of channel blockers using Hoffman modulation contrast optics in Olympus IX71 microscope at 10×10 magnification.
Figure 7
Figure 7. Blockers of the Ca2+-activated potassium channels BK and IK1 suppress proliferation of U251 cells in a dose dependent fashion.
(A) Dose response curves for the effects of the BK channel inhibitors, paxilline and penitrem A, on proliferation of U251 cells. Arrow indicates concentration of paxilline that was used to block K+ currents in the electrophysiology experiments presented in (D). (B) Dose response curves for the effects of the IK1 channel inhibitors, clotrimazole and TRAM-34, on proliferation of U251 cells. Arrow indicates concentration of clotrimazole that was used to block K+ currents in the electrophysiological experiments presented in (E). (C) Dose response curves for the effects of the selective SK1-3 channel blocker UCL1848 on proliferation of U251 cells. (D) Effect of the “aged” paxilline on the whole-cell BK currents. Cell proliferation medium containing 10 µM paxilline was collected after 24-hr incubation in cell proliferation assays, diluted 10-fold with electrophysiological bath solution, and used for inhibiting BK currents. Nominal concentration of paxilline was 1 µM (indicated by arrow in (A), to compare proliferation and electrophysiology data). Representative of three experiments. (E) Effect of the “aged” clotrimazole on the whole-cell IK1 currents. Cell proliferation medium containing 10 µM clotrimazole was collected after 24-hr incubation in cell proliferation assays, diluted 10-fold, and used for inhibiting IK1 currents. Nominal concentration of clotrimazole was 1 µM (indicated by arrow in (B)). Representative of three experiments. (F) Comparison of normalized effects of the “aged” paxilline and clotrimazole on the whole cell K+ currents to their effects on cell proliferation. Inhibition of BK and IK1 currents was calculated as average inhibition of the whole K+ cell currents at +140 and 0 mV for BK and IK1, respectively.
Figure 8
Figure 8. Effects BK and IK1 gene silencing on macroscopic K+ current densities and proliferation rates in U251 glioma cells.
(A) Effect of the BK-specific siRNAs on BK mRNA expression levels. U251 cells were transfected with negative control siRNA (NC) or two different siRNAs targeting BK (si1-BK, and si2-BK). 48 hrs post transfection, mRNA levels were quantified and normalized to housekeeping genes GAPDH and RPL13A using reverse transcription qPCR. Data are the mean values ±SE of 3-5 independent transfections. (B) Representative traces of whole-cell BK currents measured at 72 hrs after transfection with negative control siRNA (NC) or siRNA targeting BK (si2-BK). (C) Average BK current densities in U251 cells transfected with negative control (NC) or si2-BK siRNAs, as compared to non-transfected cells (WT). BK current density was measured as paxilline-sensitive K+ currents at +140 mV. Data are the mean values ±SE from 11-17 cells per group. **p<0.01, vs. negative control and non-transfected cells. (D) Effect of transfection with negative control (NC) or BK siRNAs (si1-BK, si2-BK) on proliferation of U251 measured 72 hrs post transfection using Coulter counter assay. Data are the mean values ±SE of 3 independent cell transfections. (E) Effect of the IK1-specific siRNAs on IK1 mRNA expression levels. mRNA levels were quantified and normalized to housekeeping genes GAPDH and RPL13A 48 hrs after transfection with negative control siRNA (NC), and three different siRNAs targeting IK1 (si5-IK1, and si6-IK1, si7-IK1. Data are the mean values ±SE in 3 independent transfections. (F) Representative whole-cell K+ currents measured 72 hrs after transfection with negative control siRNA (NC) or IK1siRNA (si7-IK1). (G) Average IK1 current densities in cells transfected with negative control (NC) or si7-IK1 siRNAs, as compared to non-transfected cells (WT). IK1 current density was measured as clotrimazole-sensitive K+ currents at 0 mV with 2 µM paxilline added to bath solution. Data are the mean values ±SE from 14-15 cells per experimental group, and n = 6 in WT. **p<0.01, vs. negative control and non-transfected cells. (H) Effect of nucleofection with negative control siRNA (NC), or IK1-siRNA (si5-IK1, si6-IK1, si7-IK1) on cell proliferation measured 72 hrs post nucleofection using MTT assay. Data are the mean values ±SE of 3 independent cell transfections.

Similar articles

Cited by

References

    1. Wrensch M, Minn Y, Chew T, Bondy M, Berger MS. Epidemiology of primary brain tumors: current concepts and review of the literature. Neuro Oncol. 2002;4:278–299. - PMC - PubMed
    1. Schwartzbaum JA, Fisher JL, Aldape KD, Wrensch M. Epidemiology and molecular pathology of glioma. Nat Clin Pract Neurol. 2006;2:494–503. - PubMed
    1. Kleihues P, Burger PC, Scheithauer BW. The new WHO classification of brain tumours. Brain Pathol. 1993;3:255–268. - PubMed
    1. Barnholtz-Sloan JS, Sloan AE, Schwartz AG. Relative survival rates and patterns of diagnosis analyzed by time period for individuals with primary malignant brain tumor, 1973-1997. J Neurosurg. 2003;99:458–466. - PubMed
    1. Sanai N, Berger MS. Glioma extent of resection and its impact on patient outcome. Neurosurgery. 2008;62:753–764. - PubMed

Publication types

MeSH terms

Substances