

Disruption of PTH receptor 1 in T cells protects against PTH-induced bone loss
- PMID: 20808842
- PMCID: PMC2924900
- DOI: 10.1371/journal.pone.0012290
Disruption of PTH receptor 1 in T cells protects against PTH-induced bone loss
Abstract
Background: Hyperparathyroidism in humans and continuous parathyroid hormone (cPTH) treatment in mice cause bone loss by regulating the production of RANKL and OPG by stromal cells (SCs) and osteoblasts (OBs). Recently, it has been reported that T cells are required for cPTH to induce bone loss as the binding of the T cell costimulatory molecule CD40L to SC receptor CD40 augments SC sensitivity to cPTH. However it is unknown whether direct PTH stimulation of T cells is required for cPTH to induce bone loss, and whether T cells contribute to the bone catabolic activity of PTH with mechanisms other than induction of CD40 signaling in SCs.
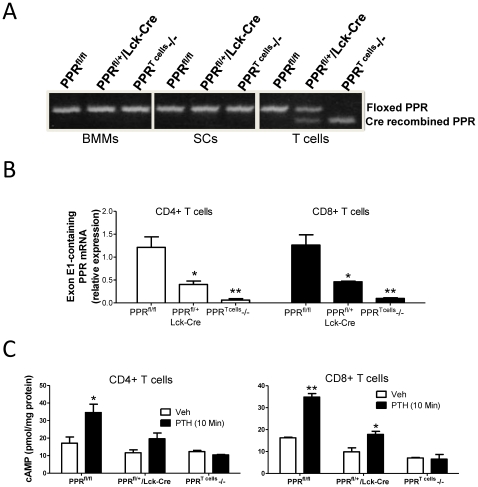
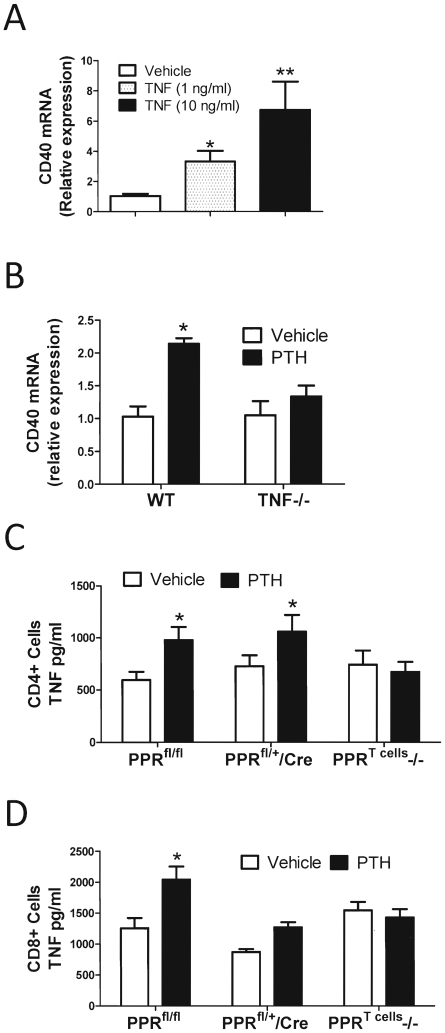
Methodology/principal findings: Here we show that silencing of PTH receptor 1 (PPR) in T cells blocks the bone loss and the osteoclastic expansion induced by cPTH, thus demonstrating that PPR signaling in T cells is central for PTH-induced reduction of bone mass. Mechanistic studies revealed that PTH activation of the T cell PPR stimulates T cell production of the osteoclastogenic cytokine tumor necrosis factor alpha (TNF). Attesting to the relevance of this effect, disruption of T cell TNF production prevents PTH-induced bone loss. We also show that a novel mechanism by which TNF mediates PTH induced osteoclast formation is upregulation of CD40 expression in SCs, which increases their RANKL/OPG production ratio.
Conclusions/significance: These findings demonstrate that PPR signaling in T cells plays an essential role in PTH induced bone loss by promoting T cell production of TNF. A previously unknown effect of TNF is to increase SC expression of CD40, which in turn increases SC osteoclastogenic activity by upregulating their RANKL/OPG production ratio. PPR-dependent stimulation of TNF production by T cells and the resulting TNF regulation of CD40 signaling in SCs are potential new therapeutic targets for the bone loss of hyperparathyroidism.
Conflict of interest statement
Figures


Similar articles
-
Parathyroid Diseases and T Cells.Curr Osteoporos Rep. 2017 Jun;15(3):135-141. doi: 10.1007/s11914-017-0359-y. Curr Osteoporos Rep. 2017. PMID: 28421466 Free PMC article. Review.
-
T cells potentiate PTH-induced cortical bone loss through CD40L signaling.Cell Metab. 2008 Aug;8(2):132-45. doi: 10.1016/j.cmet.2008.07.001. Cell Metab. 2008. PMID: 18680714 Free PMC article.
-
IL-17 Receptor Signaling in Osteoblasts/Osteocytes Mediates PTH-Induced Bone Loss and Enhances Osteocytic RANKL Production.J Bone Miner Res. 2019 Feb;34(2):349-360. doi: 10.1002/jbmr.3600. Epub 2018 Nov 6. J Bone Miner Res. 2019. PMID: 30399207
-
Parathyroid hormone (PTH)/PTH-related peptide type 1 receptor (PPR) signaling in osteocytes regulates anabolic and catabolic skeletal responses to PTH.J Biol Chem. 2013 Jul 12;288(28):20122-34. doi: 10.1074/jbc.M112.441360. Epub 2013 Jun 2. J Biol Chem. 2013. PMID: 23729679 Free PMC article.
-
T cells, osteoblasts, and osteocytes: interacting lineages key for the bone anabolic and catabolic activities of parathyroid hormone.Ann N Y Acad Sci. 2016 Jan;1364(1):11-24. doi: 10.1111/nyas.12969. Epub 2015 Dec 10. Ann N Y Acad Sci. 2016. PMID: 26662934 Free PMC article. Review.
Cited by
-
Silencing of parathyroid hormone (PTH) receptor 1 in T cells blunts the bone anabolic activity of PTH.Proc Natl Acad Sci U S A. 2012 Mar 20;109(12):E725-33. doi: 10.1073/pnas.1120735109. Epub 2012 Mar 5. Proc Natl Acad Sci U S A. 2012. PMID: 22393015 Free PMC article.
-
CKD-MBD: from the Pathogenesis to the Identification and Development of Potential Novel Therapeutic Targets.Curr Osteoporos Rep. 2018 Dec;16(6):693-702. doi: 10.1007/s11914-018-0486-0. Curr Osteoporos Rep. 2018. PMID: 30291515 Review.
-
Catabolic and anabolic actions of parathyroid hormone on the skeleton.J Endocrinol Invest. 2011 Nov;34(10):801-10. doi: 10.3275/7925. Epub 2011 Sep 23. J Endocrinol Invest. 2011. PMID: 21946081 Free PMC article. Review.
-
PTH induces bone loss via microbial-dependent expansion of intestinal TNF+ T cells and Th17 cells.Nat Commun. 2020 Jan 24;11(1):468. doi: 10.1038/s41467-019-14148-4. Nat Commun. 2020. PMID: 31980603 Free PMC article.
-
Parathyroid Diseases and T Cells.Curr Osteoporos Rep. 2017 Jun;15(3):135-141. doi: 10.1007/s11914-017-0359-y. Curr Osteoporos Rep. 2017. PMID: 28421466 Free PMC article. Review.
References
-
- Riggs BL, Melton LJ., 3rd Involutional osteoporosis. N Engl J Med. 1986;314:1676–1686. - PubMed
-
- Grey AB, Stapleton JP, Evans MC, Reid IR. Accelerated bone loss in post-menopausal women with mild primary hyperparathyroidism. Clin Endocrinol (Oxf) 1996;44:697–702. - PubMed
-
- Parisien M, Dempster DW, Shane E, Bilezikian JP. The parathyroids Basic and clinical concepts. San Diego: Academic Press; 2001. Histomorphometric analysis of bone in primary hyperparathyroidism. pp. 423–436.
-
- Potts J. Primary hyperparathyroidism. In: Avioli LV, Krane S, editors. Metabolic Bone Diseases. #rd ed. San Diego: Academic Press; 1998. pp. 411–442.
-
- Silverberg SJ, Shane E, de la Cruz L, Dempster DW, Feldman F, et al. Skeletal disease in primary hyperparathyroidism. J Bone Miner Res. 1989;4:283–291. - PubMed
Publication types
MeSH terms
Substances
Grants and funding
LinkOut - more resources
Full Text Sources
Other Literature Sources
Molecular Biology Databases
Research Materials
