. 2010 Aug 19;6(8):e1001063.
doi: 10.1371/journal.ppat.1001063.

Micro RNAs of Epstein-Barr virus promote cell cycle progression and prevent apoptosis of primary human B cells

Affiliations

Micro RNAs of Epstein-Barr virus promote cell cycle progression and prevent apoptosis of primary human B cells

Eri Seto et al. PLoS Pathog. .

Abstract

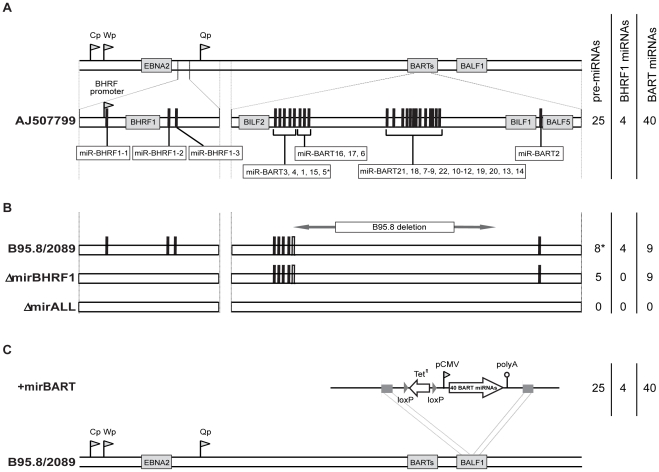
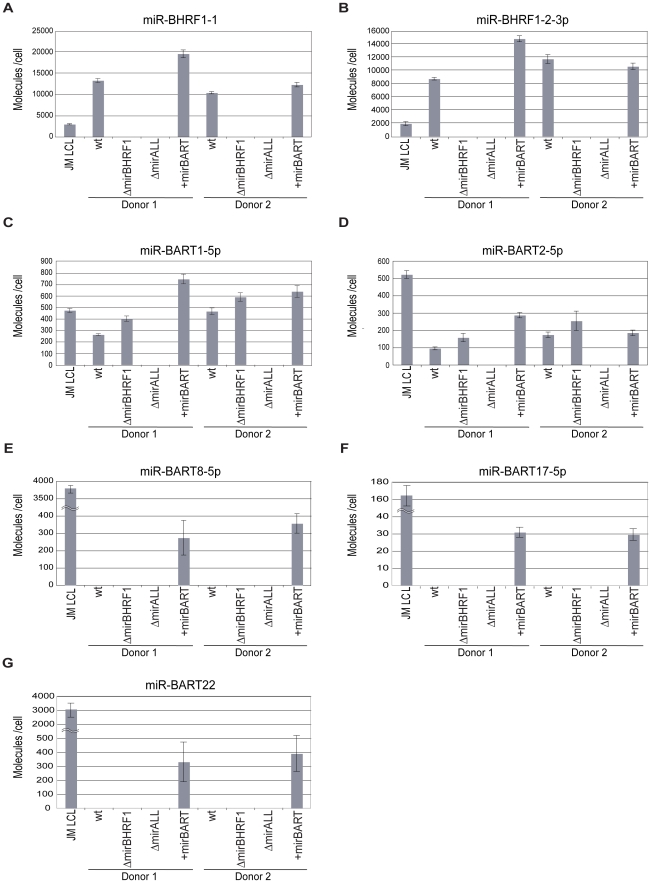
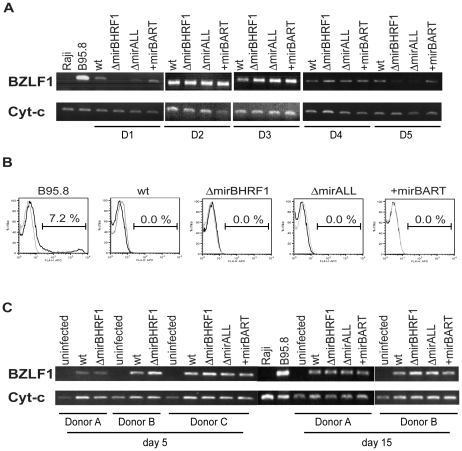
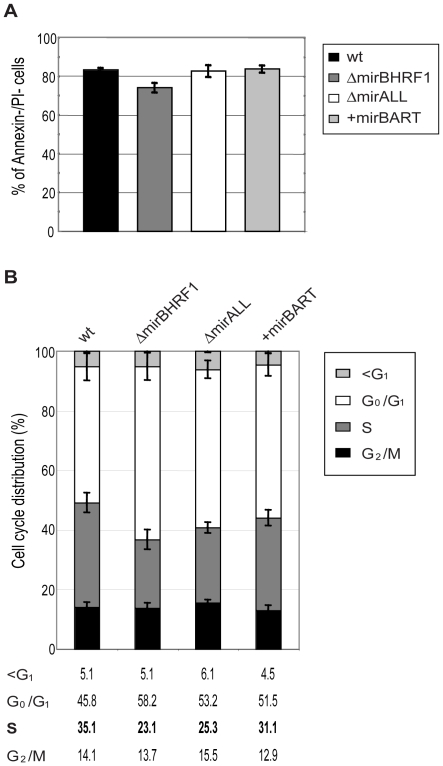
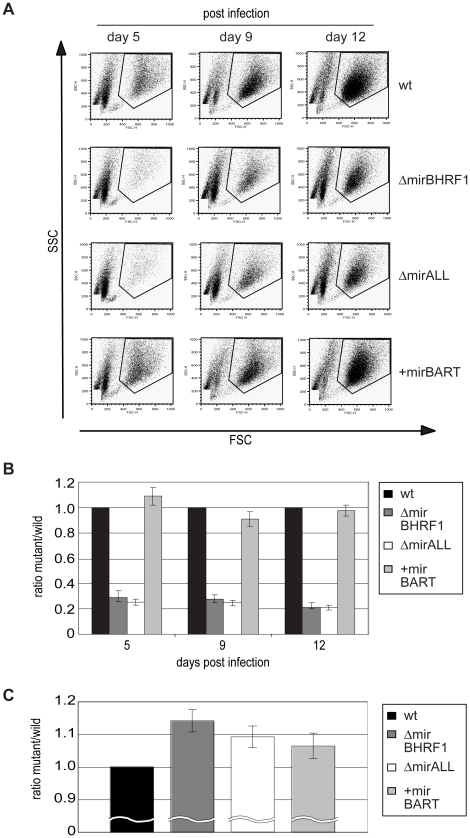
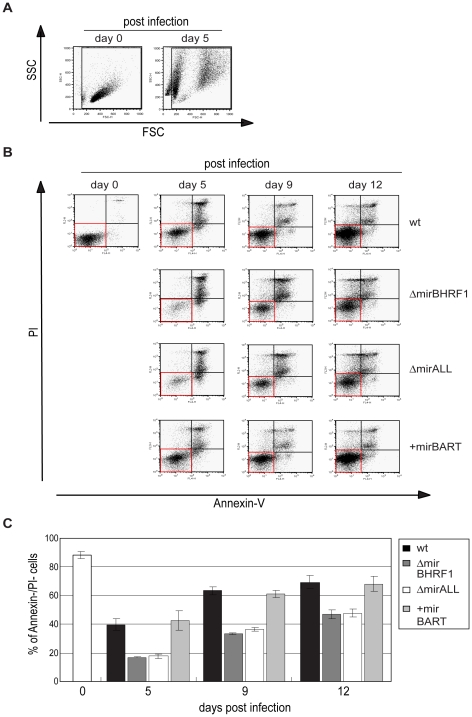
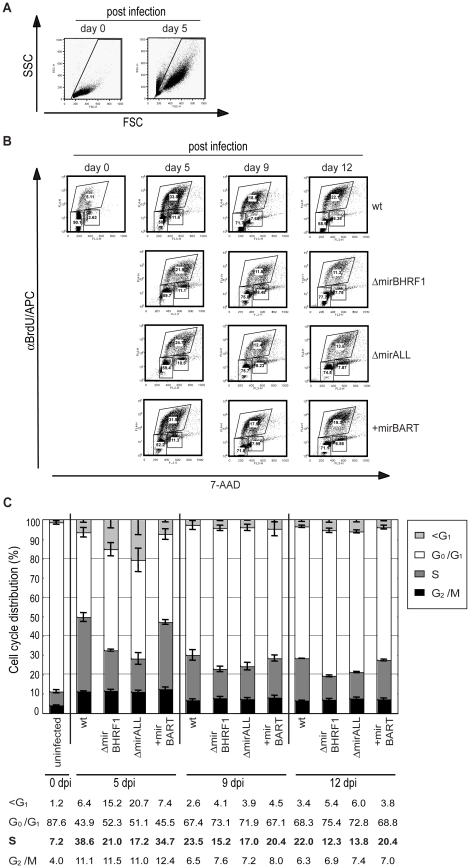
Cellular and viral microRNAs (miRNAs) are involved in many different processes of key importance and more than 10,000 miRNAs have been identified so far. In general, relatively little is known about their biological functions in mammalian cells because their phenotypic effects are often mild and many of their targets still await identification. The recent discovery that Epstein-Barr virus (EBV) and other herpesviruses produce their own, barely conserved sets of miRNAs suggests that these viruses usurp the host RNA silencing machinery to their advantage in contrast to the antiviral roles of RNA silencing in plants and insects. We have systematically introduced mutations in EBV's precursor miRNA transcripts to prevent their subsequent processing into mature viral miRNAs. Phenotypic analyses of these mutant derivatives of EBV revealed that the viral miRNAs of the BHRF1 locus inhibit apoptosis and favor cell cycle progression and proliferation during the early phase of infected human primary B cells. Our findings also indicate that EBV's miRNAs are not needed to control the exit from latency. The phenotypes of viral miRNAs uncovered by this genetic analysis indicate that they contribute to EBV-associated cellular transformation rather than regulate viral genes of EBV's lytic phase.


Conflict of interest statement

The authors have declared that no competing interests exist.

Figures

Figure 1
Figure 1. Schematic overview of the construction of miRNA-mutated EBVs.
(A) Genomic localization of EBV's miRNAs in the EBV reference strain AJ507799. The two miRNA families of EBV originate from two transcripts that fold into 25 pre-miRNAs as indicated by black bars and give rise to four mature BHRF1 miRNAs and 40 BART miRNAs. (B) Functional ablation of EBV's miRNAs. Prototype 2089 EBV is based on the prototypic EBV strain B95.8 , which was cloned in E. coli . As compared to the Genbank entry of the hypothetical EBV reference strain AJ507799, the genome of B95.8 suffers from a deletion and therefore lacks the coding capacity of the majority of the BART miRNAs as indicated. In E. coli, the three pre-miRNA structures in the BHRF1 locus of prototype 2089 EBV were replaced with computed scrambled sequences (Table 1) to generate a functional BHRF1 miRNA knock-out EBV termed ΔmirBHRF1 (or p4004). In a subsequent step, the remaining five BART pre-miRNAs were replaced with scrambled sequences to generate an EBV genome devoid of any miRNAs. This mutant was termed ΔmirALL (or 4027). The sequence of miR-BART5 is present in the genome of prototype 2089 EBV but due to the deletion in the parental B95.8 strain the pre-miRNA cannot form the hairpin structure needed for miR-BART5's processing by Drosha as indicated (*) in Figure 1B. (C) Construction of a reconstituted EBV mutant encoding 22 BART pre-miRNAs. The expression cassette p4079, which encodes all pre-miRNAs of the BART locus, was introduced into the BALF1 locus of the prototype 2089 EBV genome by homologous recombination as indicated. The EBV mutant that carries all BART miRNAs encoded by conventional EBV strains, was termed +mirBART (or p4080).
Figure 2
Figure 2. Absolute quantification of EBV-encoded miRNAs in established LCLs infected with prototype 2089 or miRNA-mutant EBVs.
Steady-state levels of two BHRF1 miRNAs (panels A, B) and five BART miRNAs (panels C to G) in prototype 2089 or miRNA-mutant EBV-infected LCLs from two different donors were determined by quantitative stem-loop PCR assays. Two BART miRNAs present in the wild-type reference strain B95.8 (panels C, D) and three BART miRNAs deleted in B95.8 but present in +mirBART EBV (panels E to G) were subjected to quantification. JM LCL is a spontaneous LCL infected with an uncharacterized field strain of EBV encoding 44 viral miRNAs. The numbers of miRNA molecules per cell were determined and calculated with standards generated with RNA of ΔmirALL EBV-infected LCLs doped with serial dilutions of synthetic miRNAs. The reconstructions were based on quantification of total RNA harvested from a known number of cells of the different LCLs prior to quantitative stem-loop PCRs. Results are shown as absolute miRNA molecules per RNA mass obtained from a single cell. Data represent the means and standard deviations of three independent quantifications. Prototype 2089 EBV-infected cells are indicated (wt).
Figure 3
Figure 3. Expression of BZLF1 and BLLF1 in prototype 2089 or miRNA mutant EBV-infected LCLs.
(A) Semi-quantitative RT-PCRs of transcripts of the immediate-early gene BZLF1 in established LCLs from five different donors (D1 to D5) infected with prototype 2089 EBV (wt) or the indicated miRNA mutants. cDNAs prepared from B95.8 and Raji cells served as positive and negative controls, respectively. The levels of cytochrome c mRNA were used as loading controls. (B) FACS analysis of the surface expression of gp350/220 encoded by the late EBV gene BLLF1. LCLs were stained with a mouse anti-gp350 monoclonal antibody, followed by APC-conjugated goat anti-mouse IgG antibody (black histograms). The gray histograms represent the staining of the secondary antibody, only. A 7.2% fraction of B95.8 cells spontaneously supports EBV's lytic phase. One representative set of LCLs from one out of five different donors is shown. (C) Semi-quantitative RT-PCR analysis of BZLF1 transcripts in primary B cells at day 5 and 15 p.i. infected with prototype 2089 EBV (wt) or the indicated miRNA mutant EBVs. Primary human B cells isolated from adenoids were infected at a concentration of 4.5×10⁵ per ml with an MOI of 0.2.
Figure 4
Figure 4. Established LCLs infected with BHRF1 miRNA mutant EBVs show an altered cell cycle distribution but no survival phenotype.
Long-term (three to five months p.i.) cultured cells infected with either prototype 2089 or miRNA-mutated EBVs were analyzed for spontaneous apoptosis and cell cycle distribution. (A) Established LCLs were plated (105 per ml) in fresh medium and cultured for two days. The cells were analyzed by FACS for Annexin-V and PI staining. The error bars represent the standard deviation of the mean of cells in this experiment from five different donors. (B) Cell cycle analysis of established LCLs. Cells were plated (105 per ml) in fresh medium and cultured for two days, then analyzed by standard BrdU incorporation assays. The error bars represent the standard deviation of the mean of cells in this experiment from four different donors.
Figure 5
Figure 5. Outgrowth of primary human B cells infected with prototype 2089 or miRNA-mutated EBVs.
Primary human B cells of three donors isolated from adenoids (4.5×10⁵ per ml) were infected with either prototype 2089 or miRNA-mutated EBVs at an MOI of 0.05. At day 5, 9, and 12 p.i., cells were harvested and their outgrowth analyzed by FACS. To determine the absolute number of cells counted, a volume standard was added prior to FACS analysis as described . (A) Representative results of FACS analysis. EBV-infected cells with elevated forward (FSC) and sideward (SSC) scatter characteristics indicative of activated lymphoblast cells were gated as indicated and the number of cells in this gate was recorded. (B) The ratios of the numbers of lymphoblastic cells infected with single miRNA mutant EBVs versus prototype 2089 EBV-infected cells were calculated. Functional deletion of EBV-encoded BHRF1 miRNAs led to substantially lower numbers of outgrowing lymphoblasts compared to wild-type EBV-infected cells. The error bars represent the standard deviation of the mean of cells from three different donors. (C) Doubling times of primary B cells infected with either prototype 2089 or miRNA-mutated EBVs calculated from the results in (B).
Figure 6
Figure 6. Spontaneous apoptosis of primary B cells infected with prototype or miRNA-mutated EBVs.
To examine the spontaneous apoptosis of primary B cells early after infection, the samples as shown in Figure 5 were analyzed by FACS for Annexin-V binding and propidium iodide (PI) staining at different time points p.i.. (A) FSC and SSC characteristics of uninfected and prototype 2089 EBV-infected primary B cells on day 0 and day 5 p.i., respectively. To exclude subcellular debris but include highly granular, presumably dying or dead cells, only cells within the indicated gate were analyzed for their Annexin-V and PI staining. (B) Annexin V/PI staining analysis of B cells infected with 2089 EBV or miRNA mutants at different time points p.i.. One representative experiment out of three is shown. Cells in the AnnexinV/PI quadrants (red boxes) indicate surviving cells at each time point p.i.. (C) Summary of the data shown in (B). The proportion of live, AnnexinV/PI cells at each time point p.i. was calculated. Fewer live cells were detected after ΔmirBHRF1 or ΔmirALL EBV infection than after prototype 2089 or +mirBART EBV infection indicating an anti-apoptotic role of the BHRF1 miRNAs during the early phase of B cell infection. The error bars represent the standard deviation of the mean of three different experiments.
Figure 7
Figure 7. Cell cycle distribution of primary human B cells infected with miRNA-mutant or prototype 2089 EBVs.
Primary B cells (4.5×10⁵ per ml) were infected with an MOI of 0.05 of each virus stock as indicated or left uninfected. BrdU incorporation, 7-AAD counterstaining and FACS analysis determined the cell cycle profiles of cells with characteristics of resting lymphocytes and activated lymphoblasts. (A) FSC and SSC distribution characteristics of uninfected and prototype 2089 EBV-infected primary B cells on day 0 and day 5 p.i.. To exclude subcellular debris and highly granular, presumably dying or dead cells, only cells within the indicated gate were analyzed. (B) FACS analysis for their BrdU and 7-AAD staining. One representative experiment out of three is shown. Gates used to define cells in G1/G0, S and G2/M are indicated. (C) The compiled data (mean values and standard deviations) of three experiments as exemplified in panel B indicate the different cell cycle profiles of infected B cells at three time points p.i.. Cells infected with ΔmirBHRF1 or ΔmirALL EBV mutants showed an increased fraction of cells in G0/G1 and a concomitant decrease of cells in S as compared to cells infected with prototype 2089 EBV or +mirBART mutant EBV. Likewise, more cells were found in the subG1 fraction when the cultures were infected with ΔmirBHRF1 or ΔmirALL EBV mutants. The differences in cell cycle distributions were most obvious early after infection on day 5 and diminished thereafter.

Similar articles

Cited by

References

    1. Kim VN, Han J, Siomi MC. Biogenesis of small RNAs in animals. Nat Rev Mol Cell Biol. 2009;10:126–139. - PubMed
    1. Bartel DP. MicroRNAs: genomics, biogenesis, mechanism, and function. Cell. 2004;116:281–297. - PubMed
    1. Landgraf P, Rusu M, Sheridan R, Sewer A, Iovino N, et al. A mammalian microRNA expression atlas based on small RNA library sequencing. Cell. 2007;129:1401–1414. - PMC - PubMed
    1. Bartel DP. MicroRNAs: target recognition and regulatory functions. Cell. 2009;136:215–233. - PMC - PubMed
    1. Ambros V. The functions of animal microRNAs. Nature. 2004;431:350–355. - PubMed

Publication types