

CodonTest: modeling amino acid substitution preferences in coding sequences
- PMID: 20808876
- PMCID: PMC2924240
- DOI: 10.1371/journal.pcbi.1000885
CodonTest: modeling amino acid substitution preferences in coding sequences
Abstract
Codon models of evolution have facilitated the interpretation of selective forces operating on genomes. These models, however, assume a single rate of non-synonymous substitution irrespective of the nature of amino acids being exchanged. Recent developments have shown that models which allow for amino acid pairs to have independent rates of substitution offer improved fit over single rate models. However, these approaches have been limited by the necessity for large alignments in their estimation. An alternative approach is to assume that substitution rates between amino acid pairs can be subdivided into rate classes, dependent on the information content of the alignment. However, given the combinatorially large number of such models, an efficient model search strategy is needed. Here we develop a Genetic Algorithm (GA) method for the estimation of such models. A GA is used to assign amino acid substitution pairs to a series of rate classes, where is estimated from the alignment. Other parameters of the phylogenetic Markov model, including substitution rates, character frequencies and branch lengths are estimated using standard maximum likelihood optimization procedures. We apply the GA to empirical alignments and show improved model fit over existing models of codon evolution. Our results suggest that current models are poor approximations of protein evolution and thus gene and organism specific multi-rate models that incorporate amino acid substitution biases are preferred. We further anticipate that the clustering of amino acid substitution rates into classes will be biologically informative, such that genes with similar functions exhibit similar clustering, and hence this clustering will be useful for the evolutionary fingerprinting of genes.
Conflict of interest statement
The authors have declared that no competing interests exist.
Figures
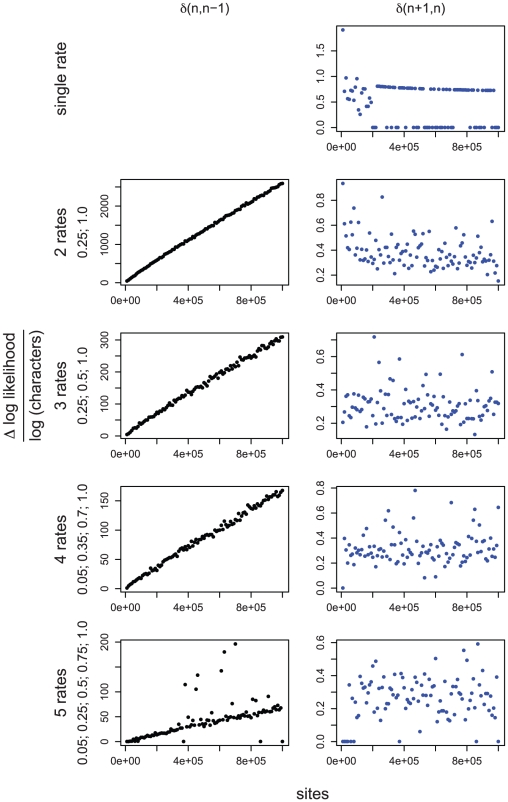
 ) normalized by the logarithm of the sample size (number of characters), between best fitting GA models with
  and
and  rates (
 ), against the number of sites in the alignment. For simulations with a single rate class we plotted
  , top right. Figures for multiple rate simulations (2–5 rates) show
  as black dots (left column); and
  as blue dots (right column). Values to the right of row report simulated rates for each class. The left column is a reflection of power, whereas the right column – of the degree of over-fitting. For the case where a single rate was simulated, the degree of over-fitting is the rate of false positives. The desired behavior for
  is achieved when the model with
  rate classes is preferred to models with
  , and
, and  rate classes. For a modified BIC criterion
  with
with  , the former happens if
  (more definitively with increasing sample size), and the latter if
  (regardless of sample size).
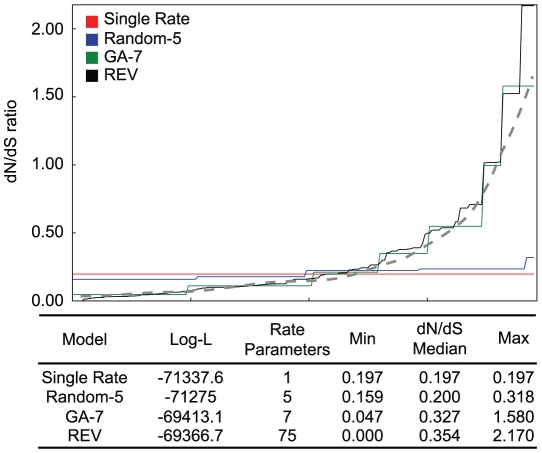
 inferred 7 non-synonymous rate classes. The idealized biological rate distribution (unobservable) is depicted by the dashed line. The goodness of fit, the complexity of the models, and the range of maximum likelihood parameter estimates are listed in the table.
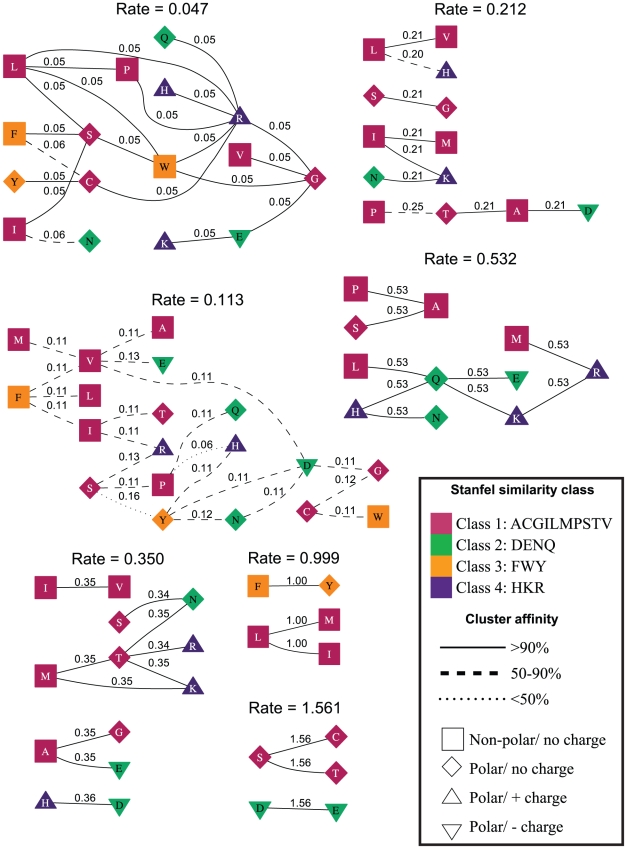
 . The residues (nodes) are annotated by their biochemical properties and Stanfel class, and the rates (edges) are labeled with model-averaged (
 ) rate estimates. The style of an edge is determined by its cluster affinity, where high cluster affinities indicate that a large proportion of models in the credible set were consistent with the structured
  model.
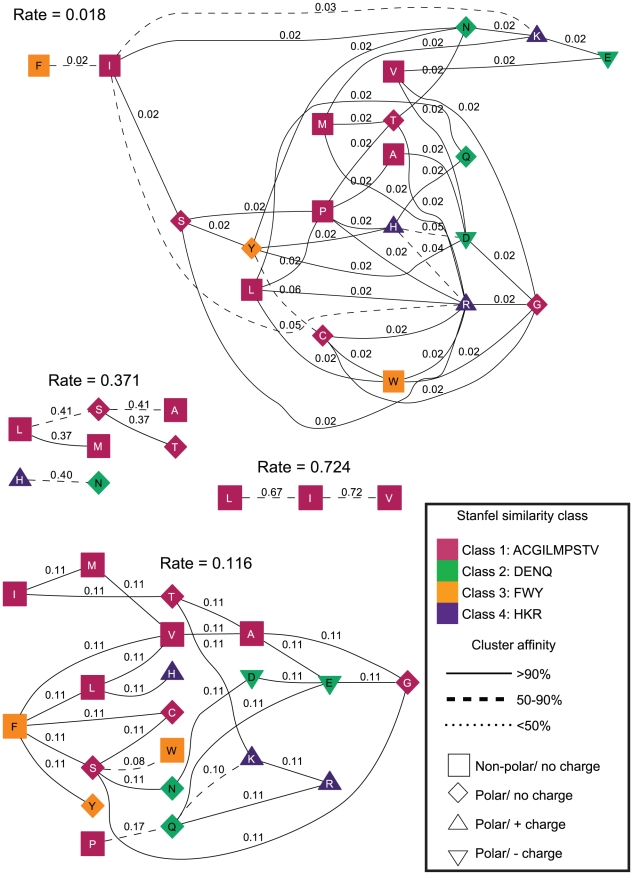
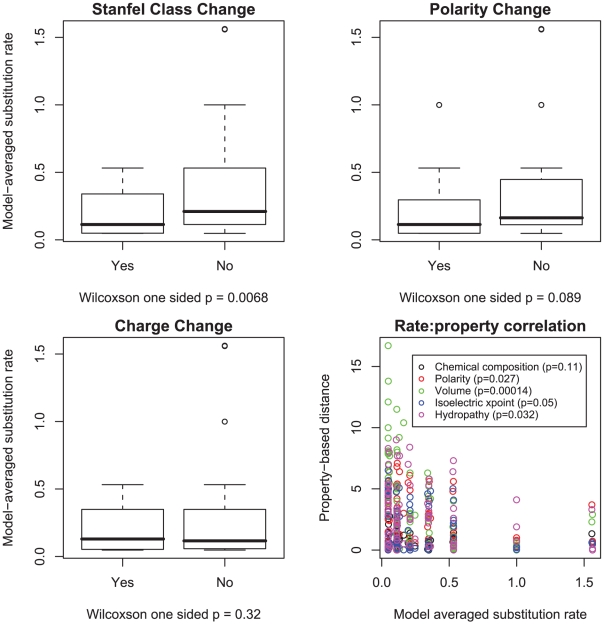
 rates were stratified by whether or not they involved a change in polarity, charge or Stanfel class, the medians of two rate distributions were compared using a one sided Wilcoxon rank-sum test. We further correlated the magnitude of substitution rates with one of five property-based distances between the corresponding residues (defined in [18]) using a one-sided (negative correlation) Pearson product-moment correlation test.
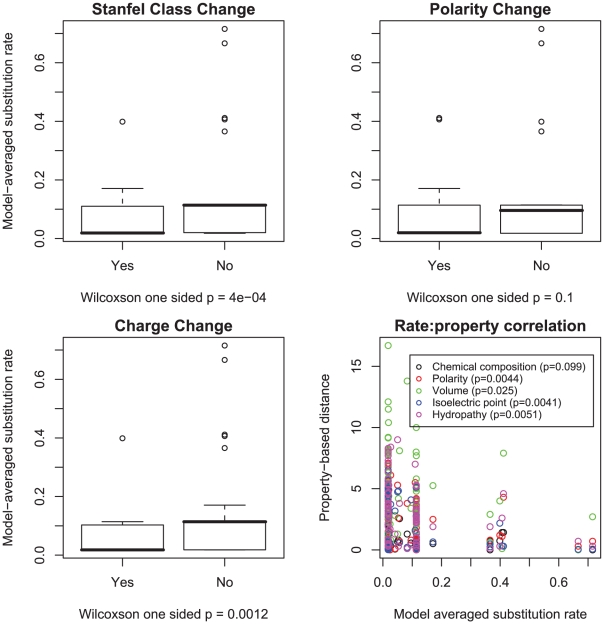
 rates were stratified by whether or not they involved a change in polarity, charge or Stanfel class, the medians of two rate distributions were compared using a one sided Wilcoxon rank-sum test. We further correlated the magnitude of substitution rates with one of five property-based distances between the corresponding residues (defined in [18]) using a one-sided (negative correlation) Pearson product-moment correlation test.
Similar articles
-
A generalized mechanistic codon model.Mol Biol Evol. 2014 Sep;31(9):2528-41. doi: 10.1093/molbev/msu196. Epub 2014 Jun 23. Mol Biol Evol. 2014. PMID: 24958740 Free PMC article.
-
Benchmarking multi-rate codon models.PLoS One. 2010 Jul 21;5(7):e11587. doi: 10.1371/journal.pone.0011587. PLoS One. 2010. PMID: 20657773 Free PMC article.
-
Advantages of a mechanistic codon substitution model for evolutionary analysis of protein-coding sequences.PLoS One. 2011;6(12):e28892. doi: 10.1371/journal.pone.0028892. Epub 2011 Dec 29. PLoS One. 2011. PMID: 22220197 Free PMC article.
-
Extensive purifying selection acting on synonymous sites in HIV-1 Group M sequences.Virol J. 2008 Dec 23;5:160. doi: 10.1186/1743-422X-5-160. Virol J. 2008. PMID: 19105834 Free PMC article. Review.
-
Next-generation development and application of codon model in evolution.Front Genet. 2023 Jan 27;14:1091575. doi: 10.3389/fgene.2023.1091575. eCollection 2023. Front Genet. 2023. PMID: 36777719 Free PMC article. Review.
Cited by
-
Gene-wide identification of episodic selection.Mol Biol Evol. 2015 May;32(5):1365-71. doi: 10.1093/molbev/msv035. Epub 2015 Feb 19. Mol Biol Evol. 2015. PMID: 25701167 Free PMC article.
-
Improved inference of site-specific positive selection under a generalized parametric codon model when there are multinucleotide mutations and multiple nonsynonymous rates.BMC Evol Biol. 2019 Jan 14;19(1):22. doi: 10.1186/s12862-018-1326-7. BMC Evol Biol. 2019. PMID: 30642241 Free PMC article.
-
A generalized mechanistic codon model.Mol Biol Evol. 2014 Sep;31(9):2528-41. doi: 10.1093/molbev/msu196. Epub 2014 Jun 23. Mol Biol Evol. 2014. PMID: 24958740 Free PMC article.
-
Intragenic homogenization and multiple copies of prey-wrapping silk genes in Argiope garden spiders.BMC Evol Biol. 2014 Feb 20;14:31. doi: 10.1186/1471-2148-14-31. BMC Evol Biol. 2014. PMID: 24552485 Free PMC article.
-
A random effects branch-site model for detecting episodic diversifying selection.Mol Biol Evol. 2011 Nov;28(11):3033-43. doi: 10.1093/molbev/msr125. Epub 2011 Jun 13. Mol Biol Evol. 2011. PMID: 21670087 Free PMC article.
References
-
- Felsenstein J. Evolutionary trees from DNA-sequences – a maximum-likelihood approach. J Mol Evol. 1981;17:368–376. - PubMed
-
- Muse SV, Gaut BS. A likelihood approach for comparing synonymous and nonsynonymous nucleotide substitution rates, with application to the chloroplast genome. Mol Biol Evol. 1994;11:715–724. - PubMed
-
- Goldman N, Yang Z. A codon-based model of nucleotide substitution for protein-coding DNA sequences. Mol Biol Evol. 1994;11:725–736. - PubMed
-
- Anisimova M, Kosiol C. Investigating protein-coding sequence evolution with probabilistic codon substitution models. Mol Biol Evol. 2009;26:255–271. - PubMed
Publication types
MeSH terms
Substances
Grants and funding
LinkOut - more resources
Full Text Sources
