. 2010 Aug 19;6(8):e1001064.
doi: 10.1371/journal.pgen.1001064.

Ancient protostome origin of chemosensory ionotropic glutamate receptors and the evolution of insect taste and olfaction

Affiliations

Ancient protostome origin of chemosensory ionotropic glutamate receptors and the evolution of insect taste and olfaction

Vincent Croset et al. PLoS Genet. .

Abstract

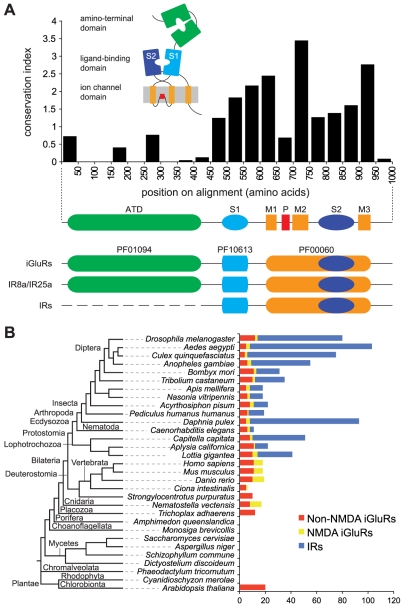
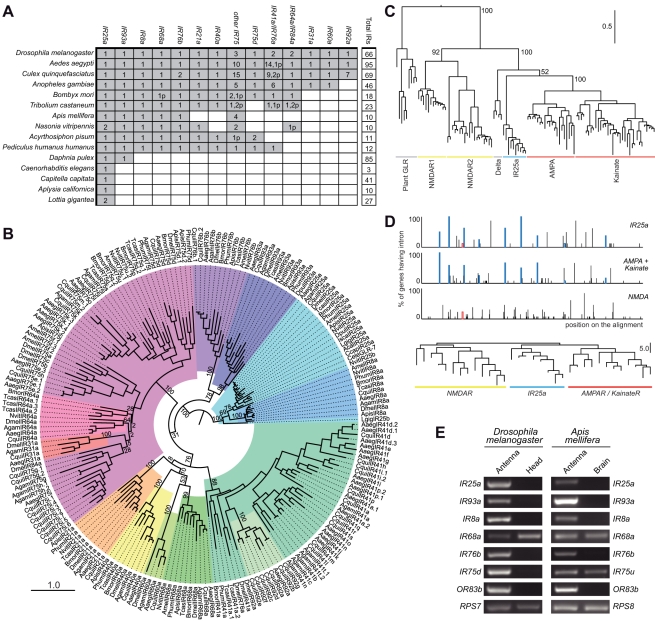
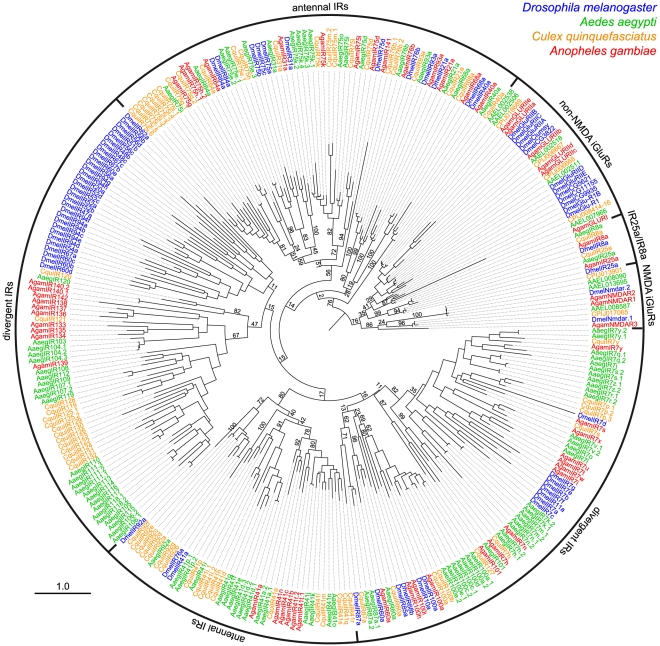
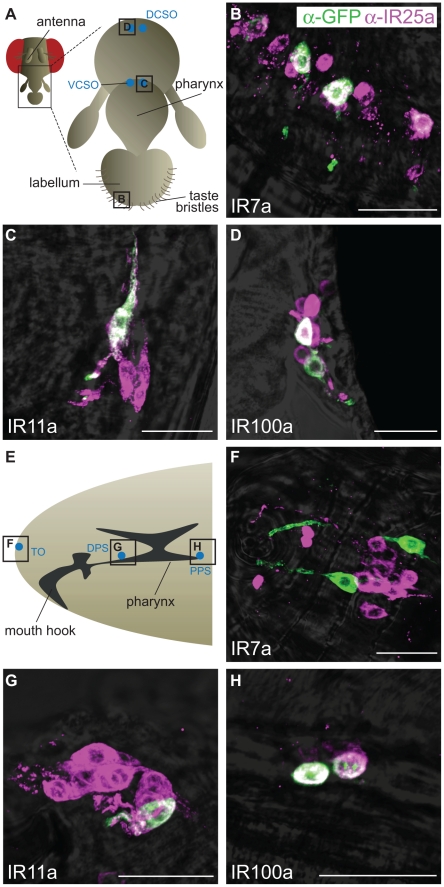
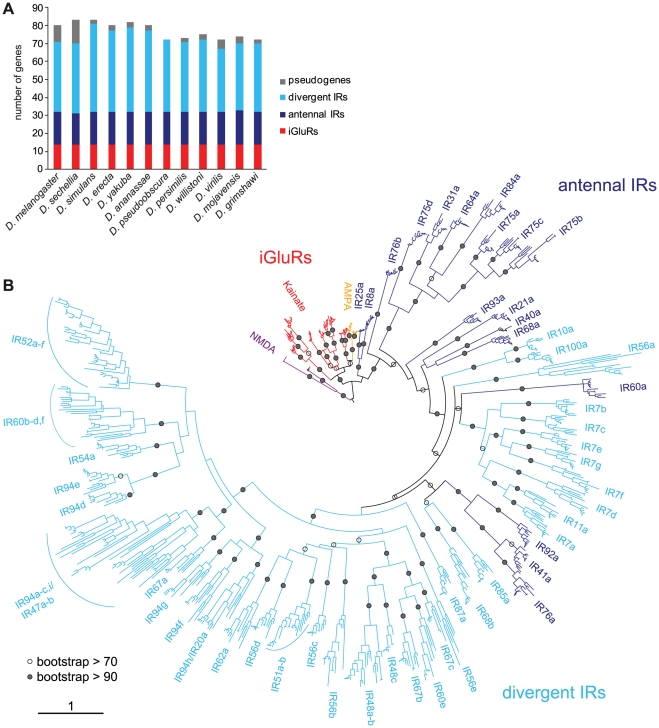
Ionotropic glutamate receptors (iGluRs) are a highly conserved family of ligand-gated ion channels present in animals, plants, and bacteria, which are best characterized for their roles in synaptic communication in vertebrate nervous systems. A variant subfamily of iGluRs, the Ionotropic Receptors (IRs), was recently identified as a new class of olfactory receptors in the fruit fly, Drosophila melanogaster, hinting at a broader function of this ion channel family in detection of environmental, as well as intercellular, chemical signals. Here, we investigate the origin and evolution of IRs by comprehensive evolutionary genomics and in situ expression analysis. In marked contrast to the insect-specific Odorant Receptor family, we show that IRs are expressed in olfactory organs across Protostomia--a major branch of the animal kingdom that encompasses arthropods, nematodes, and molluscs--indicating that they represent an ancestral protostome chemosensory receptor family. Two subfamilies of IRs are distinguished: conserved "antennal IRs," which likely define the first olfactory receptor family of insects, and species-specific "divergent IRs," which are expressed in peripheral and internal gustatory neurons, implicating this family in taste and food assessment. Comparative analysis of drosophilid IRs reveals the selective forces that have shaped the repertoires in flies with distinct chemosensory preferences. Examination of IR gene structure and genomic distribution suggests both non-allelic homologous recombination and retroposition contributed to the expansion of this multigene family. Together, these findings lay a foundation for functional analysis of these receptors in both neurobiological and evolutionary studies. Furthermore, this work identifies novel targets for manipulating chemosensory-driven behaviours of agricultural pests and disease vectors.


Conflict of interest statement

The authors have declared that no competing interests exist.

Figures

Figure 1
Figure 1. A broad phylogenetic survey of iGluR and IR genes.
(A) Top: Histogram showing the mean conservation index (number of conserved physico-chemical properties) , for 50 amino acid column-blocks of aligned D. melanogaster iGluRs and IRs, illustrating the higher conservation of the C-terminal region. The protein domain organisation of iGluRs/IRs is shown in cartoon form above the histogram and in linear form below it. Bottom: illustration of the three Pfam domains present in iGluRs and IRs. IR8a and IR25a contain the Pfam domain corresponding to the iGluR ATD. IR21a, IR40a, IR64a and IR93a also contain long N-termini (∼400 amino acids) but these have extremely low primary structural similarity to the ATD. All other IRs have much shorter N-terminal regions (∼200 amino acids) that lack homology to the ATD or other protein domains. (B) Histogram of the number of non-NMDA (red), NMDA (yellow) and IR (blue) sequences identified in the indicated eukaryotic species. An unscaled tree showing the phylogenetic relationships between these species is illustrated on the left.
Figure 2
Figure 2. Evolutionary origins and conservation of antennal IRs.
(A) Table of antennal IR orthologous groups in the indicated protostome species. A shaded square signifies the presence of at least one representative gene in a species. Figures within a square indicate the existence of multiple functional copies; the “p” suffix indicates the number of pseudogene copies. We considered as pseudogenes only those with frameshift or internal stop codons inside conserved domains due to the difficulty in accurately annotating the termini of these sequences. (B) Phylogenetic relationships of the genes shown in (A). Each colour represents a group of orthologous sequences. The sequences were aligned with PROBCONS and the tree was built with RAxML under the WAG model of substitution with 1000 bootstrap replicates. The scale bar represents the expected number of substitutions per site. (C) Phylogenetic relationships between iGluRs and all IR25a orthologues, excluding low quality or short gene annotations. The tree was built with RAxML under the WAG model of substitution, with 1000 bootstrap replicates. Bootstrap values for selected branches are shown as percentages. The scale bar represents the expected number of substitutions per site. (D) Top: Map of intron positions in an alignment of eight IR25a orthologues, 12 AMPA/Kainate receptors and 13 NMDA receptors (see Dataset S3 for alignment file). Coloured boxes illustrate introns whose positions and phases are conserved in at least one member of two different subgroups. Empty coloured boxes indicate introns conserved in position, but not in phase. Bottom: Phylogram based on the position of introns in the same subset of sequences as above. The scale bar represents the number of non-conserved intron positions. (E) RT-PCR analysis of antennal IR gene expression of orthologous genes (except DmelIR75a and AmelIR75u, which are paralogous genes) in D. melanogaster and A. mellifera tissues. Control RT-PCR products for comparative analysis of gene expression correspond to the ribosomal genes RPS7 (D. melanogaster) and RPS8 (A. mellifera). All RT-PCR products were sequenced to confirm their identity.
Figure 3
Figure 3. Olfactory expression of IRs in Aplysia molluscs.
(A) Top: Schematic representation of Aplysia, illustrating the location of selected sensory, neuronal and reproductive tissues used for RNA isolation and RT-PCR (adapted from [21]). The central nervous system samples comprised pooled cerebral, pleural, buccal, pedal and abdominal ganglia. The skin samples were taken from the side of the head. Bottom: RT-PCR analysis of Aplysia IR gene expression from the indicated species and tissues. Only rhinophores from A. californica (Acal) were tested due to limited availability of animals, while rhinophore and other tissues were examined for the closely related species A. dactylomela (Adac) . Nucleotide sequence identity of IR orthologues between these species is >85%. Control RT-PCR corresponds to β-actin. (B) Schematic of Aplysia rhinophore showing the approximate location of the field of views of the rhinophore groove olfactory tissue in (C–E). (C,D) RNA in situ hybridisation on A. dactylomela rhinophore sections using a digoxigenin-labelled antisense RNA probe for AdacIR25a. Micrographs reveal IR25a expression (blue) in small clusters of cells of a characteristic neuronal morphology close to the sensory epithelial surface. Higher magnifications of specific cellular staining (arrowhead) are shown in the insets. The scale bars represent 100 µm. (E) Control RNA in situ hybridisation on an A. dactylomela rhinophore section with a digoxigenin-labelled sense riboprobe for AdacIR25a. No signal is apparent. The scale bar represents 100 µm.
Figure 4
Figure 4. Species-specificity of divergent IR repertoires.
Phylogenetic tree of all iGluRs and IRs from D. melanogaster (blue), A. aegypti (green), C. quinquefasciatus (orange) and A. gambiae (red). Sequences were aligned with PROBCONS and the tree was built with RAxML under the WAG model of substitution, with 500 bootstrap replicates. The scale bar represents the expected number of substitutions per site. Note that due to the high divergence and number of sequences analysed, bootstrap values in several of the most internal nodes are extremely low and the position of certain large clades of IR genes on the tree are distinct from trees in other figures.
Figure 5
Figure 5. Expression of divergent IRs in D. melanogaster adult and larval gustatory organs.
Immunofluorescence with anti-GFP (green) and anti-IR25a (magenta) antibodies (overlaid on bright-field images) on whole-mount tissues from animals expressing a membrane targeted GFP reporter transgene (UAS-mCD8:GFP) under the control of the indicated IR promoter-GAL4 driver transgenes. The scale bars represent 20 µm. (A) Schematic of the adult D. melanogaster proboscis showing the location of the field of views in (B–D). DCSO: dorsal cibarial sense organ, VCSO: ventral cibarial sense organ. (B) IR7a-GAL4 drives expression of mCD8:GFP in the labellum. (C) IR11a-GAL4 drives expression of mCD8:GFP in the VCSO. (D) IR100a-GAL4 drives expression of mCD8:GFP in the DCSO. (E) Schematic of the D. melanogaster larval head showing the location of the field of views in (F–H). TO: terminal organ, DPS: dorsal pharyngeal sense organ, PPS: posterior pharyngeal sense organ. (F) IR7a-GAL4 drives expression of mCD8:GFP in the TO. (G) IR11a-GAL4 drives expression of mCD8:GFP in the DPS. (H) IR100a-GAL4 drives expression of mCD8:GFP in the PPS.
Figure 6
Figure 6. Drosophilid IR repertoires.
(A) Histogram of the number of IR and iGluR loci identified in the twelve drosophilid species. (B) Phylogenetic tree of all iGluR and IR genes (excluding pseudogenes and incomplete genes) in the twelve drosophilid species. The tree was constructed using PhyML under the JTT model of substitution and is based on the most conserved columns of an amino acid alignment. Bootstrap values were estimated using an approximate likelihood ratio test and are shown as percentages only for internal nodes. The phylogeny was rooted using the NMDA receptors. The scale bar represents the expected number of substitutions per site.
Figure 7
Figure 7. Gene loss and gain and selective pressures in drosophilid IR repertoires.
(A) Estimates of the number of IR loci (number of pseudogenes is indicated in parentheses) on internal nodes of the drosophilid phylogeny and gene gain (blue dots), gene loss (red slashes) and pseudogenisation (orange slashes) events on each branch. The gene loss and gene gain rates on the terminal branches are indicated in parentheses after the species names. (B) Histogram of the gene gain (red) and loss (black) rates estimated for the terminal branches of the phylogeny. (C) Distribution and median (horizontal line) of d N/d S rates of iGluR and IR genes estimated for all twelve drosophilid species (left) or five melanogaster subgroup species (right). d N/d S values were significantly different between iGluRs, antennal IRs and divergent IRs (p<0.01, Wilcoxon rank-sum tests). In the right-hand plot, the dashed grey lines represent the median values calculated from the d N/d S values for the melanogaster subgroup OR and GR genes, as reported in . d N/d S values were significantly different both between antennal IRs and GRs and between divergent IRs and ORs (p<0.01, Wilcoxon rank-sum tests).
Figure 8
Figure 8. Mechanisms of IR repertoire expansion.
(A) Genomic location of the IR genes (black arrowheads; pseudogenes in grey) belonging to the IR94 and IR52 clades in D. melanogaster, D. sechellia, D. ananassae and D. virilis. Equivalent chromosome arms (Muller elements) (labelled on the left of each chromosome arm) between the species are indicated by colour and horizontal alignment . Tandem arrays of genes are indicated by horizontal black lines, and the distances between close arrays are shown. The “IR” and some number prefixes for gene names are omitted in clusters where space is limiting. The scale bar represents 20 Mb for the chromosomes and 30 kb for gene lengths and distances between genes within the same tandem array. (B) Phylogenetic tree of D. melanogaster iGluRs and IRs, in which branches are colour-coded by the number of introns in each extant gene sequence or predicted ancestor. The tree was built with RAxML under the WAG model of substitution, with 1000 bootstrap replicates, and the colours representing intron numbers were inferred and displayed with Mesquite. Pseudogenes were excluded from this analysis. The scale bar represents the expected number of substitutions per site. (C) Histogram illustrating the distribution of intron positions as a percentage of protein length for iGluRs and antennal IRs (blue) and divergent IRs (red). Each bar represents the probability of occurrence of an intron at a given percentile of the protein.
Figure 9
Figure 9. A model for the evolution of iGluRs and IRs.
Schematic phylogenetic tree highlighting the branches along which specific gene families or genes appeared with their putative functions, inferred from their presence or absence in sequenced genomes of extant species (see Figure 1). Solute binding proteins (SBPs, which exhibit the same protein fold as the iGluR/IR amino terminal domain and ligand-binding domain) and ion channels were likely present in primitive life forms as related protein domains exist in Eukaryota, Bacteria and Archaea . iGluRs are shown in purple, IRs in red and insect GRs and ORs in green. Various speculative models for the origins of iGluRs are shown. Putative genetic ancestors from which IRs, GRs and ORs derived are shown in grey followed by a “>” symbol. The resolution of the phylogeny is necessarily biased towards invertebrate lineages and branch lengths contain no temporal information.

Similar articles

Cited by

References

    1. Gereau RW, Swanson GT. The Glutamate Receptors. Totowa, N.J.: Humana Press; 2008. p. xi, 576.
    1. Sobolevsky AI, Rosconi MP, Gouaux E. X-ray structure, symmetry and mechanism of an AMPA-subtype glutamate receptor. Nature. 2009;462:745–756. - PMC - PubMed
    1. Jin R, Singh SK, Gu S, Furukawa H, Sobolevsky AI, et al. Crystal structure and association behaviour of the GluR2 amino-terminal domain. Embo J. 2009;28:1812–1823. - PMC - PubMed
    1. Armstrong N, Sun Y, Chen GQ, Gouaux E. Structure of a glutamate-receptor ligand-binding core in complex with kainate. Nature. 1998;395:913–917. - PubMed
    1. Kuner T, Seeburg PH, Guy HR. A common architecture for K+ channels and ionotropic glutamate receptors? Trends Neurosci. 2003;26:27–32. - PubMed

Publication types

MeSH terms