

The transcriptomes of two heritable cell types illuminate the circuit governing their differentiation
- PMID: 20808890
- PMCID: PMC2924316
- DOI: 10.1371/journal.pgen.1001070
The transcriptomes of two heritable cell types illuminate the circuit governing their differentiation
Abstract
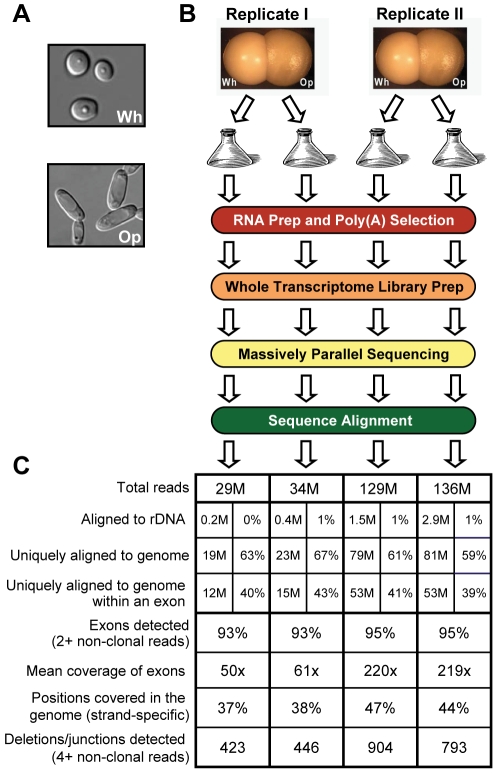
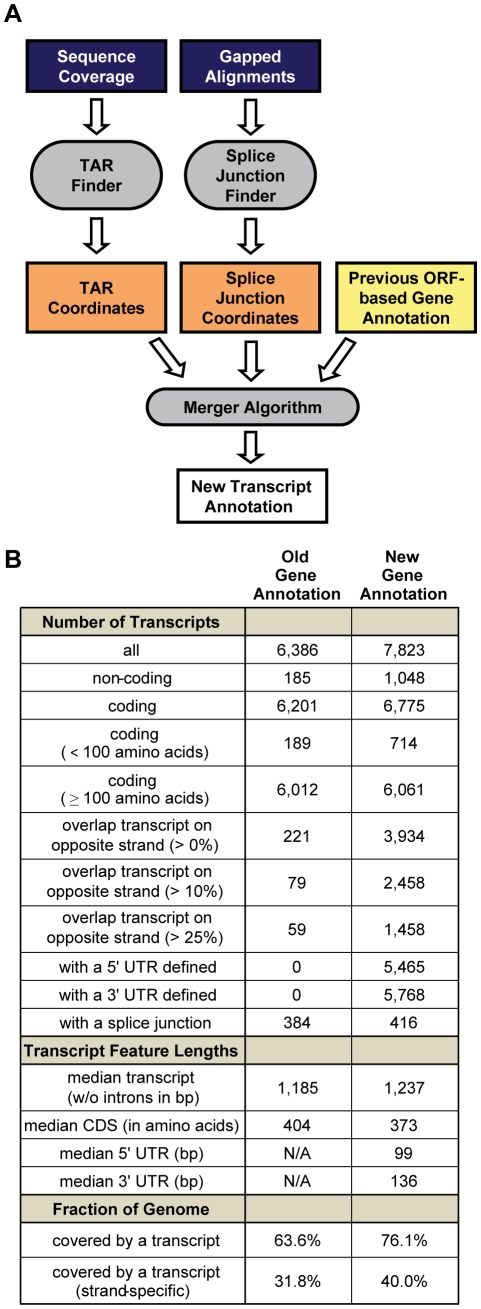
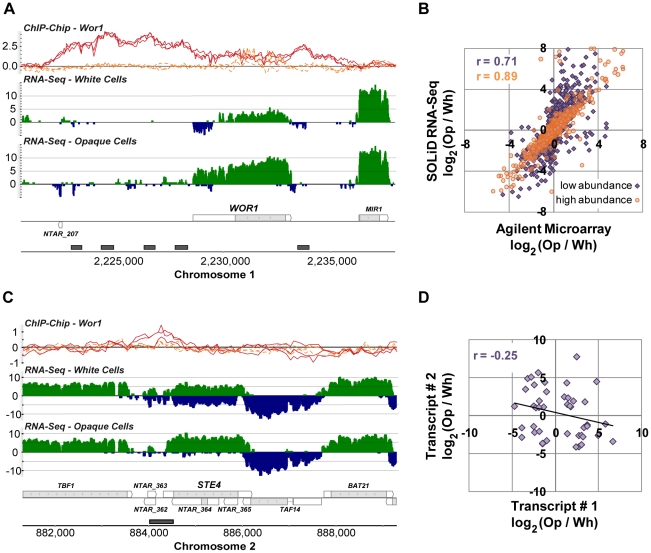
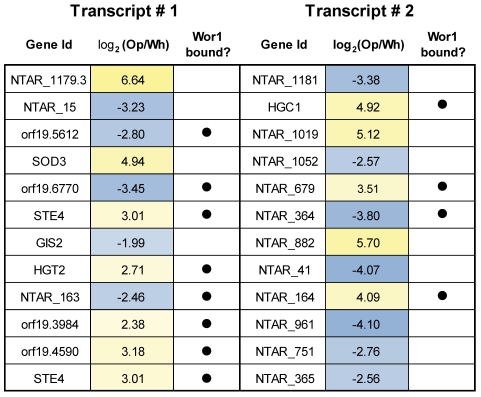
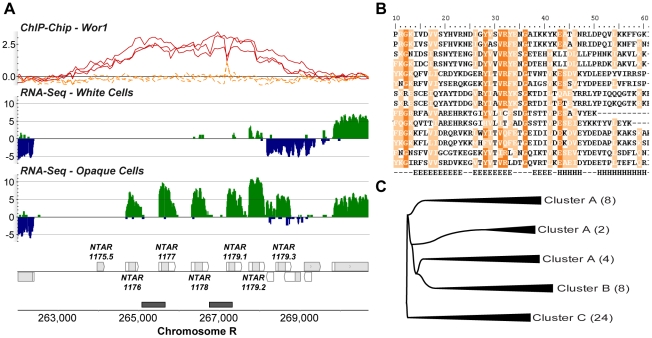
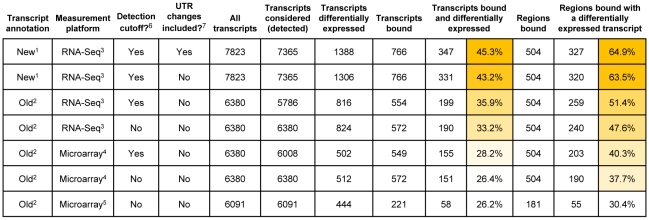
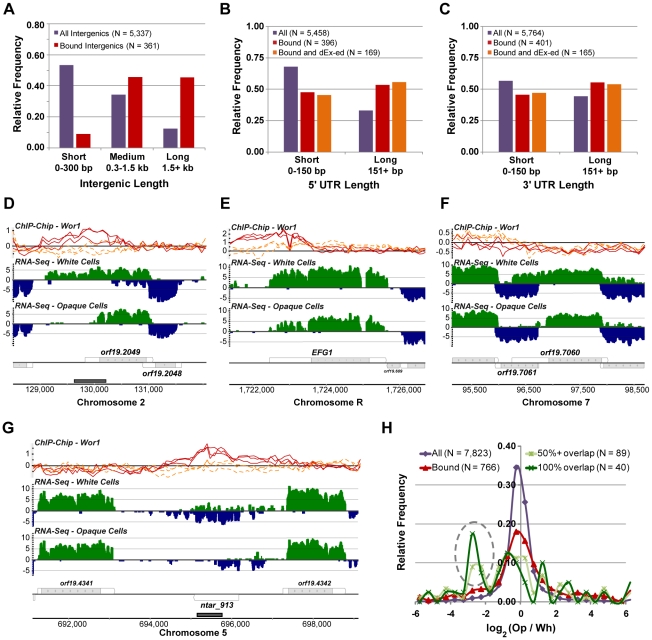
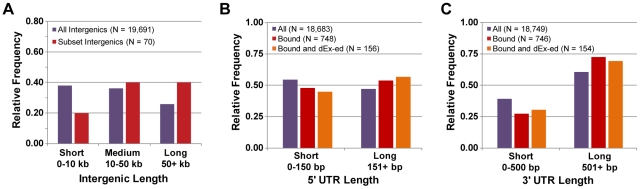
The differentiation of cells into distinct cell types, each of which is heritable for many generations, underlies many biological phenomena. White and opaque cells of the fungal pathogen Candida albicans are two such heritable cell types, each thought to be adapted to unique niches within their human host. To systematically investigate their differences, we performed strand-specific, massively-parallel sequencing of RNA from C. albicans white and opaque cells. With these data we first annotated the C. albicans transcriptome, finding hundreds of novel differentially-expressed transcripts. Using the new annotation, we compared differences in transcript abundance between the two cell types with the genomic regions bound by a master regulator of the white-opaque switch (Wor1). We found that the revised transcriptional landscape considerably alters our understanding of the circuit governing differentiation. In particular, we can now resolve the poor concordance between binding of a master regulator and the differential expression of adjacent genes, a discrepancy observed in several other studies of cell differentiation. More than one third of the Wor1-bound differentially-expressed transcripts were previously unannotated, which explains the formerly puzzling presence of Wor1 at these positions along the genome. Many of these newly identified Wor1-regulated genes are non-coding and transcribed antisense to coding transcripts. We also find that 5' and 3' UTRs of mRNAs in the circuit are unusually long and that 5' UTRs often differ in length between cell-types, suggesting UTRs encode important regulatory information and that use of alternative promoters is widespread. Further analysis revealed that the revised Wor1 circuit bears several striking similarities to the Oct4 circuit that specifies the pluripotency of mammalian embryonic stem cells. Additional characteristics shared with the Oct4 circuit suggest a set of general hallmarks characteristic of heritable differentiation states in eukaryotes.
Conflict of interest statement
Some of the authors (BBT, CKM, FMD) of this manuscript are or were employees of Life Technologies, which manufactures the sequencing instrument and some materials used in this study.
Figures
Similar articles
-
Epigenetic properties of white-opaque switching in Candida albicans are based on a self-sustaining transcriptional feedback loop.Proc Natl Acad Sci U S A. 2006 Aug 22;103(34):12807-12. doi: 10.1073/pnas.0605138103. Epub 2006 Aug 9. Proc Natl Acad Sci U S A. 2006. PMID: 16899543 Free PMC article.
-
Bistable expression of WOR1, a master regulator of white-opaque switching in Candida albicans.Proc Natl Acad Sci U S A. 2006 Aug 22;103(34):12813-8. doi: 10.1073/pnas.0605270103. Epub 2006 Aug 11. Proc Natl Acad Sci U S A. 2006. PMID: 16905649 Free PMC article.
-
The WOR1 5' untranslated region regulates white-opaque switching in Candida albicans by reducing translational efficiency.Mol Microbiol. 2015 Jul;97(1):125-38. doi: 10.1111/mmi.13014. Epub 2015 Apr 24. Mol Microbiol. 2015. PMID: 25831958 Free PMC article.
-
White-opaque switching in Candida albicans.Curr Opin Microbiol. 2009 Dec;12(6):650-4. doi: 10.1016/j.mib.2009.09.010. Epub 2009 Oct 23. Curr Opin Microbiol. 2009. PMID: 19853498 Free PMC article. Review.
-
Regulation of white-opaque switching in Candida albicans.Med Microbiol Immunol. 2010 Aug;199(3):165-72. doi: 10.1007/s00430-010-0147-0. Med Microbiol Immunol. 2010. PMID: 20390300 Review.
Cited by
-
Identification and characterization of a previously undescribed family of sequence-specific DNA-binding domains.Proc Natl Acad Sci U S A. 2013 May 7;110(19):7660-5. doi: 10.1073/pnas.1221734110. Epub 2013 Apr 22. Proc Natl Acad Sci U S A. 2013. PMID: 23610392 Free PMC article.
-
Differential regulation of white-opaque switching by individual subunits of Candida albicans mediator.Eukaryot Cell. 2013 Sep;12(9):1293-304. doi: 10.1128/EC.00137-13. Epub 2013 Jul 19. Eukaryot Cell. 2013. PMID: 23873866 Free PMC article.
-
A Wor1-Like Transcription Factor Is Essential for Virulence of Cryptococcus neoformans.Front Cell Infect Microbiol. 2018 Nov 13;8:369. doi: 10.3389/fcimb.2018.00369. eCollection 2018. Front Cell Infect Microbiol. 2018. PMID: 30483479 Free PMC article.
-
Identification and characterization of ORF19.1725, a novel gene contributing to the white cell pheromone response and virulence-associated functions in Candida albicans.Virulence. 2018 Dec 31;9(1):866-878. doi: 10.1080/21505594.2018.1456228. Virulence. 2018. PMID: 29726301 Free PMC article.
-
Genetic and behavioral adaptation of Candida parapsilosis to the microbiome of hospitalized infants revealed by in situ genomics, transcriptomics, and proteomics.Microbiome. 2021 Jun 21;9(1):142. doi: 10.1186/s40168-021-01085-y. Microbiome. 2021. PMID: 34154658 Free PMC article.
References
-
- Takahashi K, Tanabe K, Ohnuki M, Narita M, Ichisaka T, et al. Induction of pluripotent stem cells from adult human fibroblasts by defined factors. Cell. 2007;131:861–872. - PubMed
-
- Reik W. Stability and flexibility of epigenetic gene regulation in mammalian development. Nature. 2007;447:425–432. - PubMed
-
- Daley GQ, Scadden DT. Prospects for stem cell-based therapy. Cell. 2008;132:544–548. - PubMed
Publication types
MeSH terms
Substances
LinkOut - more resources
Full Text Sources
Other Literature Sources
Molecular Biology Databases
