. 2010 Aug 19;6(8):e1001074.
doi: 10.1371/journal.pgen.1001074.

Disease-associated mutations that alter the RNA structural ensemble

Affiliations

Disease-associated mutations that alter the RNA structural ensemble

Matthew Halvorsen et al. PLoS Genet. .

Abstract

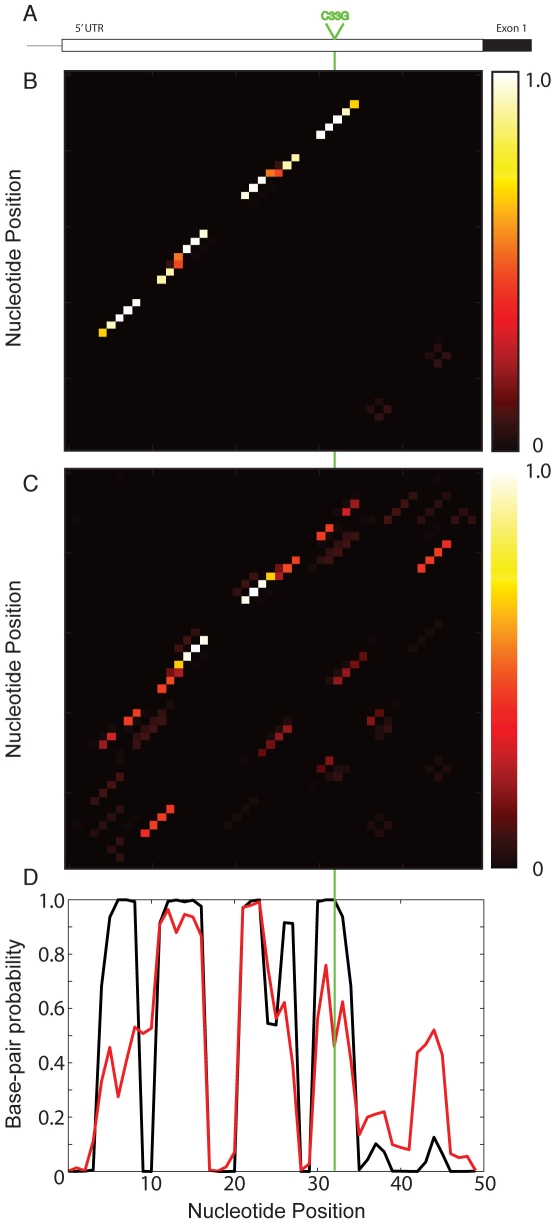
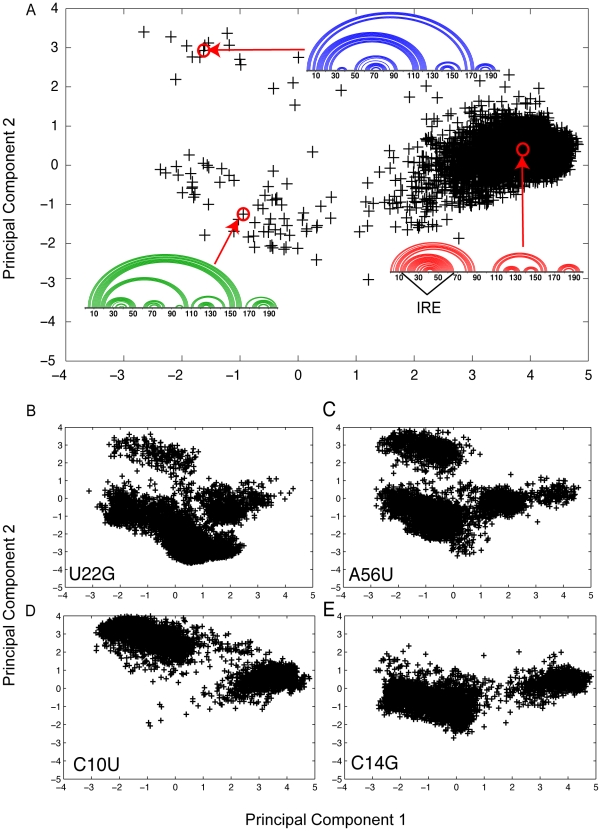
Genome-wide association studies (GWAS) often identify disease-associated mutations in intergenic and non-coding regions of the genome. Given the high percentage of the human genome that is transcribed, we postulate that for some observed associations the disease phenotype is caused by a structural rearrangement in a regulatory region of the RNA transcript. To identify such mutations, we have performed a genome-wide analysis of all known disease-associated Single Nucleotide Polymorphisms (SNPs) from the Human Gene Mutation Database (HGMD) that map to the untranslated regions (UTRs) of a gene. Rather than using minimum free energy approaches (e.g. mFold), we use a partition function calculation that takes into consideration the ensemble of possible RNA conformations for a given sequence. We identified in the human genome disease-associated SNPs that significantly alter the global conformation of the UTR to which they map. For six disease-states (Hyperferritinemia Cataract Syndrome, beta-Thalassemia, Cartilage-Hair Hypoplasia, Retinoblastoma, Chronic Obstructive Pulmonary Disease (COPD), and Hypertension), we identified multiple SNPs in UTRs that alter the mRNA structural ensemble of the associated genes. Using a Boltzmann sampling procedure for sub-optimal RNA structures, we are able to characterize and visualize the nature of the conformational changes induced by the disease-associated mutations in the structural ensemble. We observe in several cases (specifically the 5' UTRs of FTL and RB1) SNP-induced conformational changes analogous to those observed in bacterial regulatory Riboswitches when specific ligands bind. We propose that the UTR and SNP combinations we identify constitute a "RiboSNitch," that is a regulatory RNA in which a specific SNP has a structural consequence that results in a disease phenotype. Our SNPfold algorithm can help identify RiboSNitches by leveraging GWAS data and an analysis of the mRNA structural ensemble.


Conflict of interest statement

The authors have declared that no competing interests exist.

Figures

Figure 1
Figure 1. Partition function analysis of the C33G SNP in the 5′ UTR of HBB associated with β-Thalassemia .
(A) Schematic representation of the HBB gene, showing the 5′ UTR and the start of the first exon (black). The C33G SNP position is indicated in green. (B) Partition function heat map for the wild-type (non-diseased) 5′UTR RNA illustrating base-pair probabilities. The rectangle to the right of the heat map is a legend, with zero probability being black and a probability of one colored white. (C) Partition function heat map for the HBB 5′ UTR RNA with the diseased G allele at position 33. The appearance of alternative structures is apparent when compared to the non-diseased C allele above. (D) Nucleotide base-pair probability (or accessibility) of the HBB 5′ UTR for the wild-type (non-diseased, black) and mutant (disease-associated) RNA (red). The base-pair probability is computed by summing the rows (or columns) of the partition function. We compute the Pearson correlation coefficient between the wild-type (black) and disease-associated mutation (red) lines to quantify the change in the structural ensemble caused by mutation. In this case, we compute a Pearson correlation coefficient of 0.797 for the C33G mutation.
Figure 2
Figure 2. Comprehensive single mutation analysis of the HBB 5′ UTR to determine the significance of the observed rearrangement in the structural ensemble caused by mutation.
(A) Heat map diagram illustrating the Pearson correlation coefficients for all possible mutations in the HBB 5′ UTR. The heatmap color scheme is identical to that used in Figure 1B and 1C. The four rows on the diagram each indicate a different nucleotide (A, C, G, or U) while each column represents a position in the UTR. The wild-type sequence is indicated with black boxes. Only a few mutations (e.g. C33A, C10A) including the C33G result in small (<0.8) Pearson correlation coefficients. (B) Histogram of Pearson correlation coefficient values for all 150 possible mutations in the HBB 5′ UTR. A majority of mutations (<95%) have correlation coefficients greater than 0.9. We use these calculations to estimate a p-value for the significance of the observed structural change in the ensemble. (C) Similar histogram for all mutations in the 5′ UTR of the SERPINA1 gene where C116U is associated with Chronic Obstructive Pulmonary Disease (COPD) . The distribution of Pearson correlation coefficient values gets steeper with longer RNAs (the 5′ UTR of SERPINA1 is 533 nucleotides long).
Figure 3
Figure 3. Structural analysis using Boltzmann sampling and principal cponent analysis of FTL 5′ UTR and four Hyperferritinemia cataract syndrome–associated mutations .
(A) Boltzmann sampling and principal component decomposition of 5000 alternative structures of the FTL 5′ non-diseased UTR. Each cross in the diagram represents one of the 5000 structures projected onto the first two principal components . We use linear (or arc) diagrams to illustrate representative structures in the principal component space. In this case, three main clusters are observed, with the right, middle quadrant (red representative structure) being most highly populated for the WT sequence. Structures within this highly populated cluster all contain an IRE element (indicated in the figure), which has been shown to be critical in regulating FTL . (B) Effect of the U22G mutation on the RNA structural ensemble involves populating both of the alternative RNA conformations. (C) A similar redistribution occurs with the A56U mutation. (D) Only the top, left hand cluster is populated with the disease-associated C10U mutation. (E) The C14G populated the lower, left hand quadrant, which also does not form the regulatory IRE.

Comment in

Similar articles

Cited by

References

    1. Morton NE. Into the post-HapMap era. Adv Genet. 2008;60:727–742. - PubMed
    1. Mathew CG. New links to the pathogenesis of Crohn disease provided by genome-wide association scans. Nat Rev Genet. 2008;9:9–14. - PubMed
    1. Lee SH, van der Werf JH, Hayes BJ, Goddard ME, Visscher PM. Predicting unobserved phenotypes for complex traits from whole-genome SNP data. PLoS Genet. 2008;4:e1000231. doi: 10.1371/journal.pgen.1000231. - DOI - PMC - PubMed
    1. Benjamin EJ, Dupuis J, Larson MG, Lunetta KL, Booth SL, et al. Genome-wide association with select biomarker traits in the Framingham Heart Study. BMC Med Genet. 2007;8(Suppl 1):S11. - PMC - PubMed
    1. Lee ST, Choi KW, Yeo HT, Kim JW, Ki CS, et al. Identification of an Arg35X mutation in the PDCD10 gene in a patient with cerebral and multiple spinal cavernous malformations. J Neurol Sci. 2008;267:177–181. - PubMed

Publication types