. 2010 Aug 17;5(8):e12236.
doi: 10.1371/journal.pone.0012236.

Extreme evolutionary disparities seen in positive selection across seven complex diseases

Affiliations

Extreme evolutionary disparities seen in positive selection across seven complex diseases

Erik Corona et al. PLoS One. .

Abstract

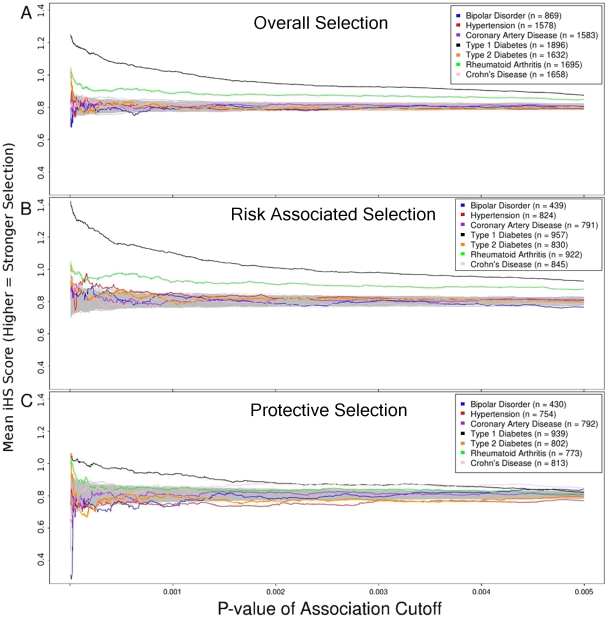
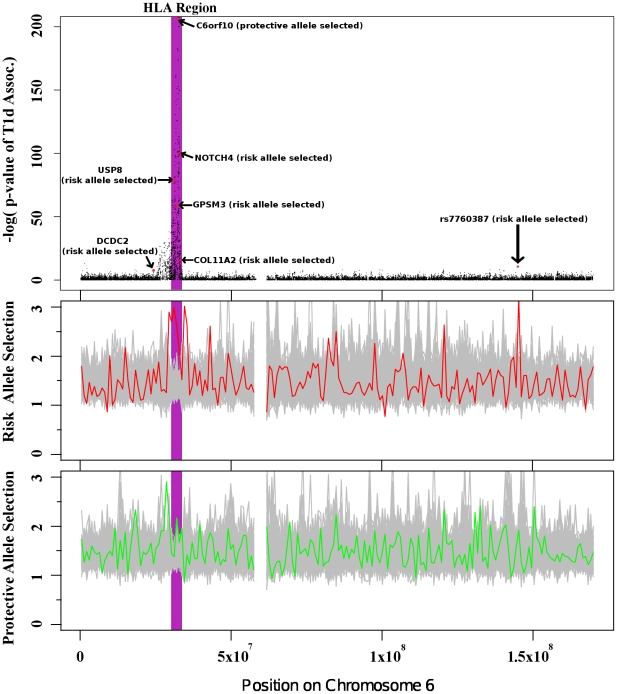
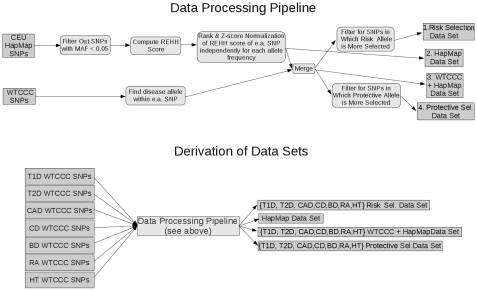
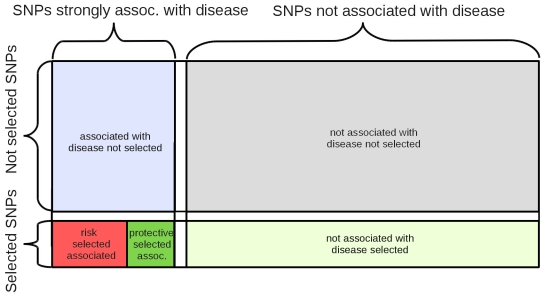
Positive selection is known to occur when the environment that an organism inhabits is suddenly altered, as is the case across recent human history. Genome-wide association studies (GWASs) have successfully illuminated disease-associated variation. However, whether human evolution is heading towards or away from disease susceptibility in general remains an open question. The genetic-basis of common complex disease may partially be caused by positive selection events, which simultaneously increased fitness and susceptibility to disease. We analyze seven diseases studied by the Wellcome Trust Case Control Consortium to compare evidence for selection at every locus associated with disease. We take a large set of the most strongly associated SNPs in each GWA study in order to capture more hidden associations at the cost of introducing false positives into our analysis. We then search for signs of positive selection in this inclusive set of SNPs. There are striking differences between the seven studied diseases. We find alleles increasing susceptibility to Type 1 Diabetes (T1D), Rheumatoid Arthritis (RA), and Crohn's Disease (CD) underwent recent positive selection. There is more selection in alleles increasing, rather than decreasing, susceptibility to T1D. In the 80 SNPs most associated with T1D (p-value <7.01 x 10(-5)) showing strong signs of positive selection, 58 alleles associated with disease susceptibility show signs of positive selection, while only 22 associated with disease protection show signs of positive selection. Alleles increasing susceptibility to RA are under selection as well. In contrast, selection in SNPs associated with CD favors protective alleles. These results inform the current understanding of disease etiology, shed light on potential benefits associated with the genetic-basis of disease, and aid in the efforts to identify causal genetic factors underlying complex disease.


Conflict of interest statement

Competing Interests: No patents or products in development are pending related to this work. The stated funding from the Hewlett Packard Foundation does not alter the authors' adherence to all the PLoS ONE policies on sharing data and materials.

Figures

Figure 1
Figure 1. Selection in 7 WTCCC diseases.
Comparison of selection pressures reveals stark heterogeneity across the 7 diseases studied. The x-axis represents the p-value of association cutoff used for each disease when calculating the mean iHS score (y-axis). Figure 1a shows Type 1 Diabetes and Rheumatoid Arthritis have strong evidence of positive selection. Type 2 Diabetes shows signs of positive selection only in the most strongly associated SNPs (left side of figure). Figures 1b and 1c expose differences in selection of risk-associated and protective alleles. Crohn's Disease shows stronger positive selection of protective alleles versus risk alleles. Like Type 1 Diabetes, Hypertension shows stronger selection for risk alleles. The gray regions represent a neutral random region used as a control, created by randomizing the data (see Methods).
Figure 2
Figure 2. Selection of Type 1 Diabetes risk associated alleles in chromosome 6.
Selection of associated alleles in chromosome six indicates that selection occurs more often on risk associated alleles versus protective alleles. The y-axis in the top plot represents how strongly each SNP is associated with Type 1 Diabetes. The y-axis in the bottom two plots represent how confident we can be that susceptibility alleles and protective alleles have been selected in each chromosomal region. The HLA (purple) region contains the strongest signs of positive selection for susceptibility alleles, yet the signal is within the neutral region for protective alleles. The second peak on the right side of the figure shows selection favors risk alleles in a region only moderately associated with the disease. Such asymmetry in selecting for risk-associated alleles suggests that SNPs in this region are more likely to be associated with the disease than the p-values suggest. Similar scans for regions moderately associated with diseases containing mutually exclusive selection of risk or protective disease alleles could be used to find novel associations. The gray regions in the bottom two graphs represent random neutral regions produced by randomizing the data (see Materials and Methods S1 for details).
Figure 3
Figure 3. Project pipeline.
The HapMap and WTCCC data sets are combined and partitioned to derive the data sets used for this study. First, the HapMap data set is filtered (SNPs with MAF <0.05 are excluded). iHS and LRH scores are then calculated for each SNP, which are Z-score and inverse rank normalized with respect to allele frequency and ancestral/derived allele state. The data is then merged with a WTCCC disease SNP data set after the “risk” allele has been extracted from the WTCCC SNP data set. This leads to 4 distinct SNP datasets; i) scored CEU HapMap SNPs, ii) the intersection of WTCCC SNPs and HapMap SNPs, iii) SNPs in which the susceptibility allele shows more selection iv) SNPs in which the protective allele show more selection. This data processing pipeline is used on all 7 WTCCC diseases, resulting in distinct data sets, which are then probed for disparities in positive selection.
Figure 4
Figure 4. Partitioning the data set.
The entire set of SNPs present in both the WTCCC and HapMap data sets was partitioned into five different categories. This study emphasizes associated SNPs partitioned into risk-associated selection and protective selected SNPs. The proportion of SNPs in these categories at cutoffs for selection and association (|iHS| >2.2 and rank normalized LRH score <0.01) is explored and used to test for differences in selection pressures among associated SNPs (p-value <0.005). Within associated SNPs, selection pressures between risk-associated selection (SNPs in which stronger selection is observed for the risk-associated allele), and protective selection are explored.

References

    1. Maddox J. Migration out of Africa. Nature. 1994;372:32. - PubMed
    1. Sabeti PC, Schaffner SF, Fry B, Lohmueller J, Varilly P, et al. Positive natural selection in the human lineage. Science. 2006;312:1614–1620. - PubMed
    1. Currat M, Trabuchet G, Rees D, Perrin P, Harding RM, et al. Molecular analysis of the beta-globin gene cluster in the Niokholo Mandenka population reveals a recent origin of the beta(S) Senegal mutation. Am J Hum Genet. 2002;70:207–223. - PMC - PubMed
    1. Chevin LM, Billiard S, Hospital F. Hitchhiking both ways: effect of two interfering selective sweeps on linked neutral variation. Genetics. 2008;180:301–316. - PMC - PubMed
    1. Plomin R, Haworth CM, Davis OS. Common disorders are quantitative traits. Nat Rev Genet. 2009;10:872–878. - PubMed

Publication types