. 2010 Aug 16;5(8):e12197.
doi: 10.1371/journal.pone.0012197.

DNA methylation profiles and their relationship with cytogenetic status in adult acute myeloid leukemia

Affiliations

DNA methylation profiles and their relationship with cytogenetic status in adult acute myeloid leukemia

Sara Alvarez et al. PLoS One. .

Abstract

Background: Aberrant promoter DNA methylation has been shown to play a role in acute myeloid leukemia (AML) pathophysiology. However, further studies to discuss the prognostic value and the relationship of the epigenetic signatures with defined genomic rearrangements in acute myeloid leukemia are required.

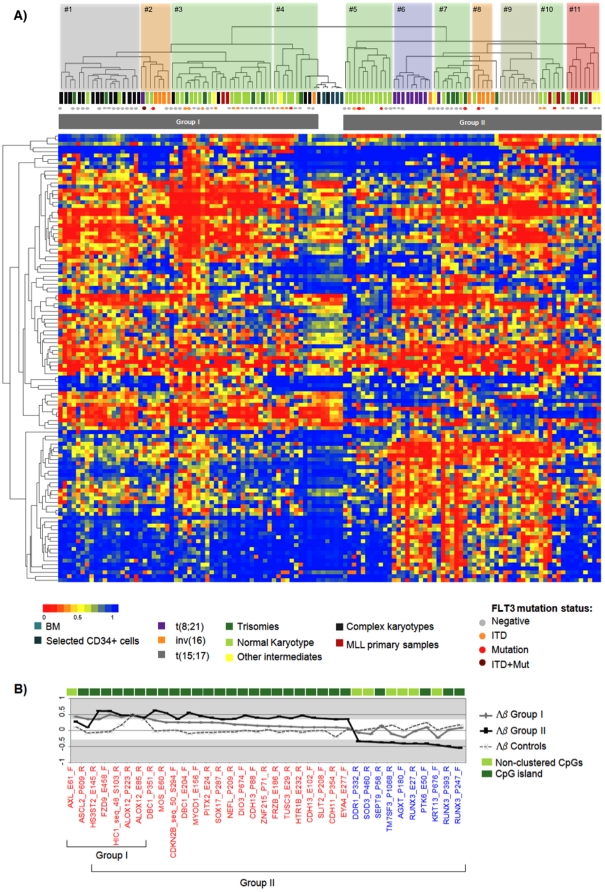
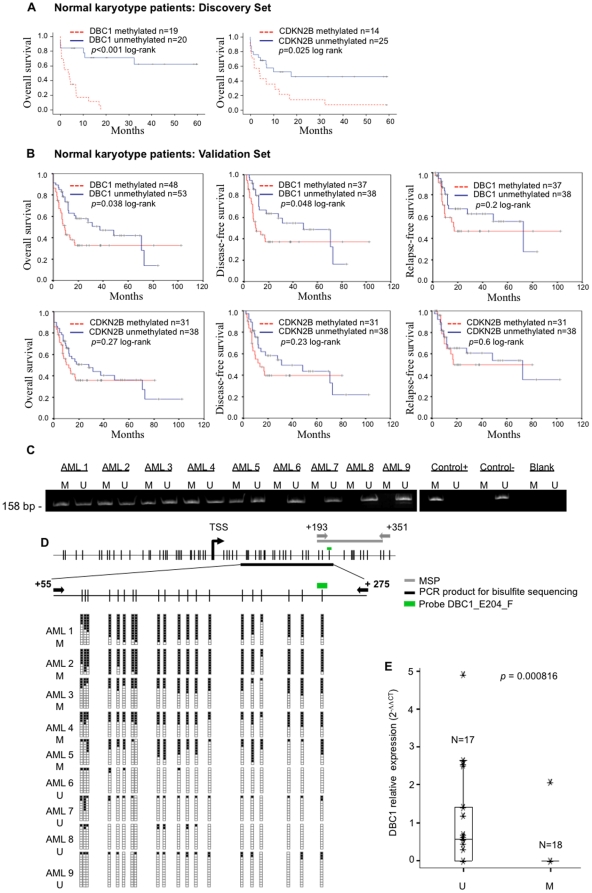
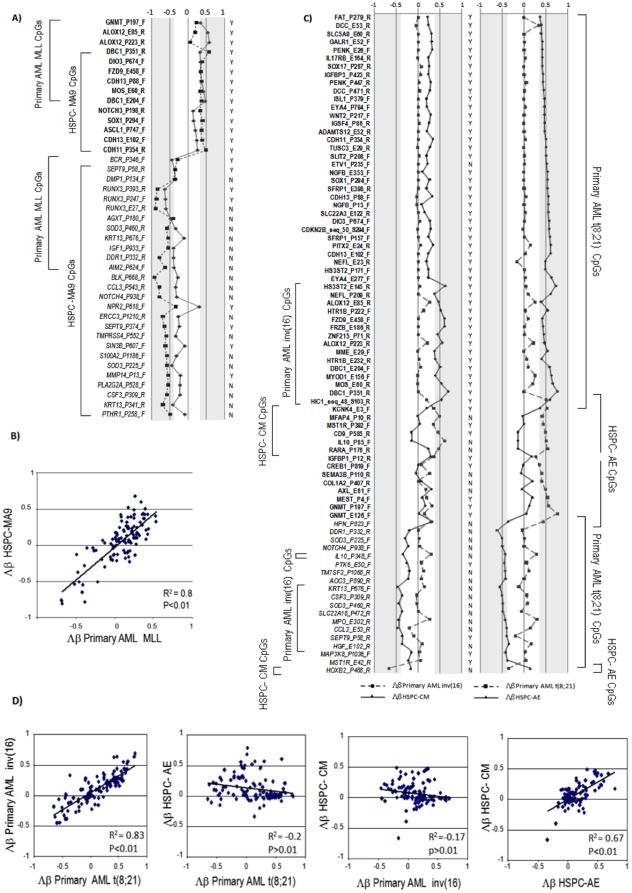
Methodology/principal findings: We carried out high-throughput methylation profiling on 116 de novo AML cases and we validated the significant biomarkers in an independent cohort of 244 AML cases. Methylation signatures were associated with the presence of a specific cytogenetic status. In normal karyotype cases, aberrant methylation of the promoter of DBC1 was validated as a predictor of the disease-free and overall survival. Furthermore, DBC1 expression was significantly silenced in the aberrantly methylated samples. Patients with chromosome rearrangements showed distinct methylation signatures. To establish the role of fusion proteins in the epigenetic profiles, 20 additional samples of human hematopoietic stem/progenitor cells (HSPC) transduced with common fusion genes were studied and compared with patient samples carrying the same rearrangements. The presence of MLL rearrangements in HSPC induced the methylation profile observed in the MLL-positive primary samples. In contrast, fusion genes such as AML1/ETO or CBFB/MYH11 failed to reproduce the epigenetic signature observed in the patients.

Conclusions/significance: Our study provides a comprehensive epigenetic profiling of AML, identifies new clinical markers for cases with a normal karyotype, and reveals relevant biological information related to the role of fusion proteins on the methylation signature.


Conflict of interest statement

Competing Interests: The authors have declared that no competing interests exist.

Figures

Figure 1
Figure 1. Unsupervised Clustering analysis of AML series and differential methylation status at specific CpG islands.
A) Thumbnail overview of the two-way (probes against samples) hierarchical cluster obtained using the complete linkage method and correlation-based distance metric on 116 AML samples and 6 controls (columns) against 115 probes with variable β values (rows). β values are depicted using a pseudocolor scale. Samples are color-coded according to the prognostically relevant cytogenetic groups, determined on the basis of conventional chromosome-banding and fluorescence in situ hybridization analysis. Cluster numbers and methylation groups are indicated. The FLT3 status of the cases is shown. B) Graphical view of the of 35 selected differentially methylated CpG (red) and differentially unmethylated CpG (blue) loci in primary AML samples, along with the Δβ values of the control samples relative to 5 CD34+ selections obtained from cord blood samples. The areas corresponding to a Δβ>0.34 and <−0.34 are shaded. The significant probes for each group of samples are indicated.
Figure 2
Figure 2. The methylation status of DBC1, influence in survival parameters and sequencing validation.
A) Kaplan-Meier plots for the 39 patients with available clinical data from the original series and a normal karyotype at diagnosis, stratified by β values at the DBC1_E204_F and CDKN2_seq50 probes (a β value >0.5 was considered as positively methylated). B) Kaplan-Meier plots and DFS and RFS curves of the validation series, considering only patients with a normal karyotype and available clinical data, stratified by the methylation status (analyzed by MSP) of the DBC1 and CDKN2B promoter. C) Examples of the MSP analysis of the DBC1 gene. A visible PCR product in lane U indicates the presence of unmethylated DBC1; a visible product in lane M indicates the presence of methylated DBC1. CpGenome Universal Methylated DNA (Intergen, New York, NY, USA) was used as a positive control for methylated alleles. DNA from bone marrow donors was used as a negative control for methylated genes. Water controls for the PCR reaction are also shown. Samples AML1, AML2, AML3, AML4, and AML5 were methylation-positive, whereas all the others were methylation-negative. D) Status of 20 CpGs in the DBC1 gene assessed by bisulfite genomic sequencing analysis on 9 AML samples. Primer design for MSP (black arrows) and bisulfite sequencing (gray arrows) is indicated. The green bar above the diagram of the DBC1 CpG island indicates the location of the probe used in the methylation arrays. Black squares, methylated CpG; white squares, unmethylated CpG dinucleotides. E) Box plot of the DBC1 relative transcript expression measured by quantitative PCR. MSP-positive and negative cases were compared using the Mann-Whitney U test.
Figure 3
Figure 3. Comparison of the methylation patterns of primary samples and hematopoietic stem cells/progenitor cells.
A) Graphical view of the 41 selected differentially methylated CpGs (bold) and differentially unmethylated CpGs (italics) in primary MLL AML samples and in the AML HSPC-MA9 samples. The area corresponding to a Δβ>0.34 or <−0.34 is shaded. The figure shows whether the selected CpG is included (Y) or not (N) in a CpG island. B) Scatter plot of the Δβ values of the 115 CpGs selected to define the AML methylation signatures. C) Graphical view of the 81 selected differentially methylated CpGs (bold) and differentially unmethylated CpGs (italics) in primary AML samples harboring t(8;21) or inv(16) and in the HSPC-AE and HSPC-CM samples. The areas corresponding to a Δβ>0.34 and <−0.34 are shaded. The figure shows whether the selected CpG is included (Y) or not (N) in a CpG island. D) Scatter plots of the Δβ values of the 115 CpGs selected to define the AML methylation signatures.

References

    1. Gilliland DG. Hematologic malignancies. Curr Opin Hematol. 2001;8:189–191. - PubMed
    1. Frohling S, Scholl C, Gilliland DG, Levine RL. Genetics of myeloid malignancies: pathogenetic and clinical implications. J Clin Oncol. 2005;23:6285–6295. - PubMed
    1. Esteller M, Fraga MF, Paz MF, Campo E, Colomer D, et al. Cancer epigenetics and methylation. Science. 2002;297:1807–1808. discussion 1807–1808. - PubMed
    1. Jones PA, Baylin SB. The epigenomics of cancer. Cell. 2007;128:683–692. - PMC - PubMed
    1. Galm O, Herman JG, Baylin SB. The fundamental role of epigenetics in hematopoietic malignancies. Blood Rev. 2006;20:1–13. - PubMed

Publication types

Substances