. 2010 Aug 16;5(8):e12200.
doi: 10.1371/journal.pone.0012200.

A new measure of centrality for brain networks

Affiliations

A new measure of centrality for brain networks

Karen E Joyce et al. PLoS One. .

Abstract

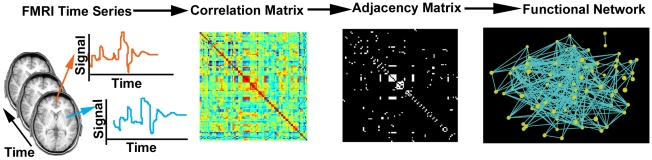
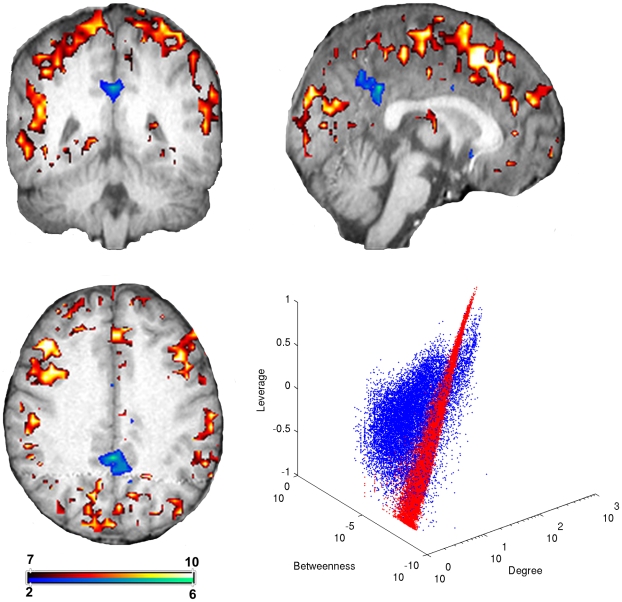
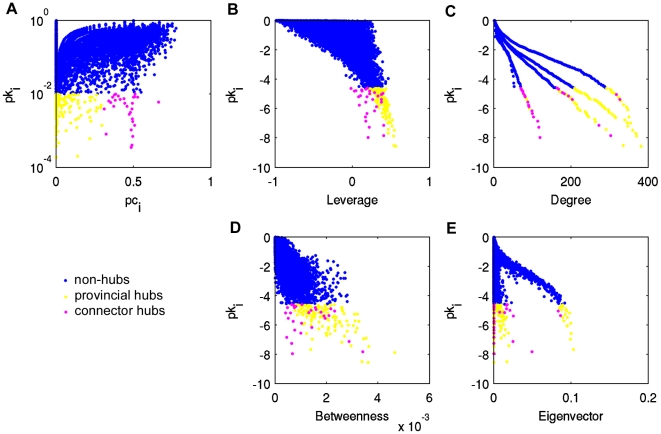
Recent developments in network theory have allowed for the study of the structure and function of the human brain in terms of a network of interconnected components. Among the many nodes that form a network, some play a crucial role and are said to be central within the network structure. Central nodes may be identified via centrality metrics, with degree, betweenness, and eigenvector centrality being three of the most popular measures. Degree identifies the most connected nodes, whereas betweenness centrality identifies those located on the most traveled paths. Eigenvector centrality considers nodes connected to other high degree nodes as highly central. In the work presented here, we propose a new centrality metric called leverage centrality that considers the extent of connectivity of a node relative to the connectivity of its neighbors. The leverage centrality of a node in a network is determined by the extent to which its immediate neighbors rely on that node for information. Although similar in concept, there are essential differences between eigenvector and leverage centrality that are discussed in this manuscript. Degree, betweenness, eigenvector, and leverage centrality were compared using functional brain networks generated from healthy volunteers. Functional cartography was also used to identify neighborhood hubs (nodes with high degree within a network neighborhood). Provincial hubs provide structure within the local community, and connector hubs mediate connections between multiple communities. Leverage proved to yield information that was not captured by degree, betweenness, or eigenvector centrality and was more accurate at identifying neighborhood hubs. We propose that this metric may be able to identify critical nodes that are highly influential within the network.


Conflict of interest statement

Competing Interests: The authors have declared that no competing interests exist.

Figures

Figure 1
Figure 1. The process of generating functional networks.
Resting state fMRI data are collected from a subject. Voxel time series are extracted from the set of images, and a Pearson correlation analysis is performed between all possible pairs of voxels. The correlations are represented in the form of a correlation matrix, which is binarized at a given threshold to yield an adjacency matrix. The functional network is thereby defined, where each voxel is represented by a node and connections are determined by the adjacency matrix.
Figure 2
Figure 2. Functional brain networks follow an exponentially truncated power law degree distribution.
Degree distributions of the whole network (solid line) and individual modules for a representative subject (subject 5). All modules as well as the whole network follow an exponentially truncated power law distribution.
Figure 3
Figure 3. Comparison of pc-z space versus pc-pk space.
(A) Within-module degree z-score zi and participation coefficient pci are used to designate nodes into seven regions as described in , , . Nodes are designated as hubs if zi≥2.5 and non-hubs otherwise. Regions are defined as: R1 – ultra-peripheral nodes; R2 – peripheral nodes; R3 – non-hub connector nodes; R4 – non-hub kinless nodes; R5 – provincial hubs; R6 – connector hubs; R7 – kinless hubs. (B) Within-module degree probability pki and participation coefficient pci are used to designate nodes into the seven regions defined above. Participation coefficient classifications are identical to (A), but the cutoff pki≤0.01 is used to define hubs versus non-hubs, corresponding to zi≥2.5 when approximating with a normal distribution.
Figure 4
Figure 4. Scatterplot matrix of leverage, degree, betweenness and eigenvector centrality for the brain network of a representative subject.
Labels to the left of plots indicate the ordinate centrality, where labels beneath plots indicate the abscissa centrality. Synthetic network nodes (red) overlaid over the original network (blue) separate nodes from the original network into distinct groups, most notably in plots involving leverage or eigenvector centrality.
Figure 5
Figure 5. Overlap image compiled from all subjects.
Intensity values correspond to the number of subjects having a particular network node, i.e. image voxel, above (warm colors) or below (cool colors) the synthetic network degree-leverage centrality scatter plot. Nodes below the synthetic distribution, primarily concentrated in the areas of the precuneus and posterior cingulate, are highly interconnected high degree nodes with many redundant connections. Nodes above the synthetic distribution have higher leverage than synthetic network nodes with the same degree and can be found scattered throughout the gray matter. Color bar represents the number of subjects that exhibited a node in any particular location.
Figure 6
Figure 6. Eigenvector centrality reveals additional network subgroups.
(A) Scatter plot of leverage, degree, and eigenvector centrality, where the lower group of nodes observed previously is shown to consist of two subgroups with different eigenvector centralities. Inset shows that the subgroup with higher eigenvector centrality (orange) has slightly lower leverage centrality than the subgroup with lower eigenvector centrality (green). (B) Spatial distribution of subgroup with higher eigenvector centrality but slightly lower leverage centrality (orange subgroup). (C) Spatial distribution of subgroup with lower eigenvector centrality but slightly higher leverage centrality (green subgroup).
Figure 7
Figure 7. Results of similarity analysis.
(A) Jaccard indices between all possible subject pairs, where the diagonal has been constrained to zero. (B) Sum of Jaccard indices for each subject, revealing subject 5 to have the highest similarity across subjects.
Figure 8
Figure 8. Modules of the brain of a representative subject.
Each color corresponds to a particular functional module, with 7 total modules present, in a representative subject (subject 5).
Figure 9
Figure 9. Extension of functional cartography.
(A) Functional cartography plot of brain network from subject 5. Within module degree probability pki is shown versus participation coefficient pci. Hubs are delineated as provincial (yellow) or connector (pink) based on thresholds defined in the text. The functional cartography plot has been extended to include leverage (B), degree (C), betweenness (D), and eigenvector centrality (E) of the same network.
Figure 10
Figure 10. Receiver Operating Characteristic curves for a representative subject.
ROC curves reflect the higher accuracy of hub detection using leverage, degree, betweenness, or eigenvector centrality. In this case the representative subject (subject 10) had AUCs closest to the mean. Results are typical of all but one subject, where degree was found to be the most accurate method.
Figure 11
Figure 11. AUCs for ROC curves for identifying hubs in all subjects.
AUC values demonstrate the accuracy of detecting hubs using leverage, degree, betweenness, or eigenvector centrality. Trend (average - diamonds) shows that the highest average AUC is for leverage centrality ROC curves. Asterisks indicate statistical significance (p<0.05).
Figure 12
Figure 12. AUCs for ROC curves for classifying hubs in all subjects.
AUC values compare the accuracy of distinguishing between provincial and connector hubs using leverage, degree, betweenness, or eigenvector centrality. Trend (average - diamonds) shows highest AUC is for leverage centrality ROC curves. Asterisk indicates statistical significance (p<0.05).

References

    1. Eguiluz VM, Chialvo DR, Cecchi GA, Baliki M, Apkarian AV. Scale-free brain functional networks. Physical Review Letters. 2005;94:018102. - PubMed
    1. van den Heuvel MP, Stam CJ, Boersma M, Pol HEH. Small-world and scale-free organization of voxel-based resting-state functional connectivity in the human brain. Neuroimage. 2008;43:528–539. - PubMed
    1. Hayasaka S, Laurienti P. Comparison of characteristics between region- and voxel-based network analyses in resting-state fMRI data. Neuroimage. 2010;50:499–508. - PMC - PubMed
    1. Fox MD, Snyder AZ, Vincent JL, Corbetta M, Van Essen DC, et al. The human brain is intrinsically organized into dynamic, anticorrelated functional networks. Proceedings of the National Academy of Sciences. 2005;102:9673–9678. - PMC - PubMed
    1. Bullmore E, Sporns O. Complex brain networks: graph theoretical analysis of structural and functional systems. Nature Review neuroscience. 2009;10:186–198. - PubMed

Publication types