Comparative Study
. 2010 Aug 17;7(8):e1000328.
doi: 10.1371/journal.pmed.1000328.

Rapid scaling up of insecticide-treated bed net coverage in Africa and its relationship with development assistance for health: a systematic synthesis of supply, distribution, and household survey data

Affiliations
Comparative Study

Rapid scaling up of insecticide-treated bed net coverage in Africa and its relationship with development assistance for health: a systematic synthesis of supply, distribution, and household survey data

Abraham D Flaxman et al. PLoS Med. .

Abstract

Background: Development assistance for health (DAH) targeted at malaria has risen exponentially over the last 10 years, with a large fraction of these resources directed toward the distribution of insecticide-treated bed nets (ITNs). Identifying countries that have been successful in scaling up ITN coverage and understanding the role of DAH is critical for making progress in countries where coverage remains low. Sparse and inconsistent sources of data have prevented robust estimates of the coverage of ITNs over time.

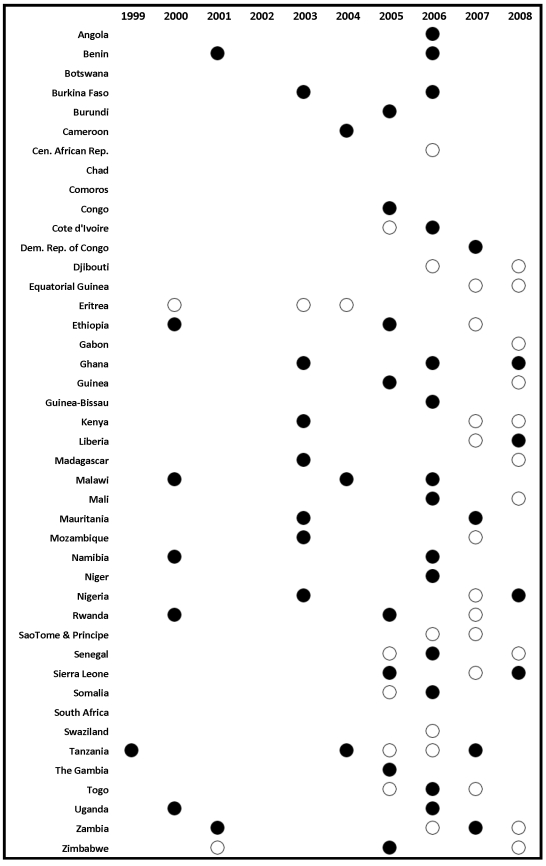
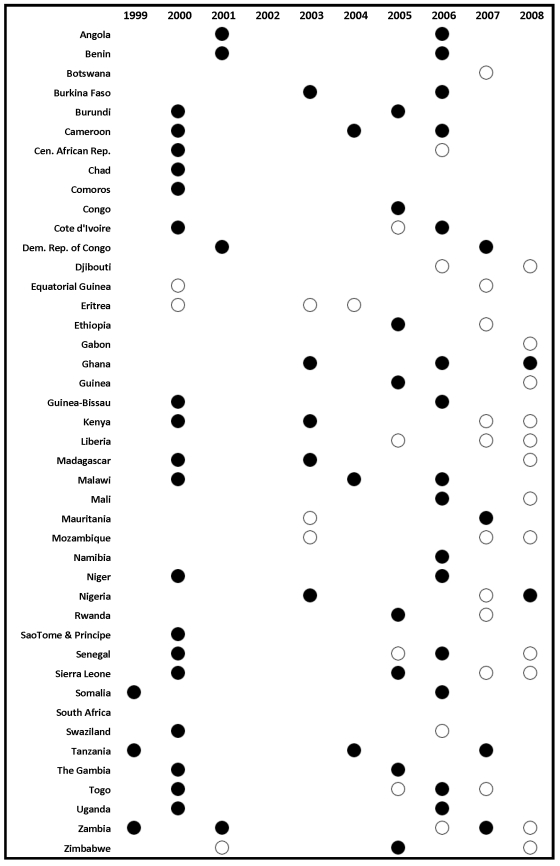
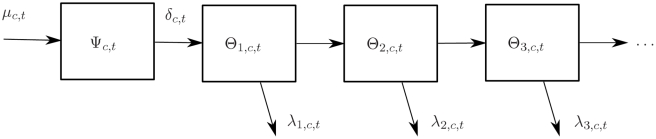
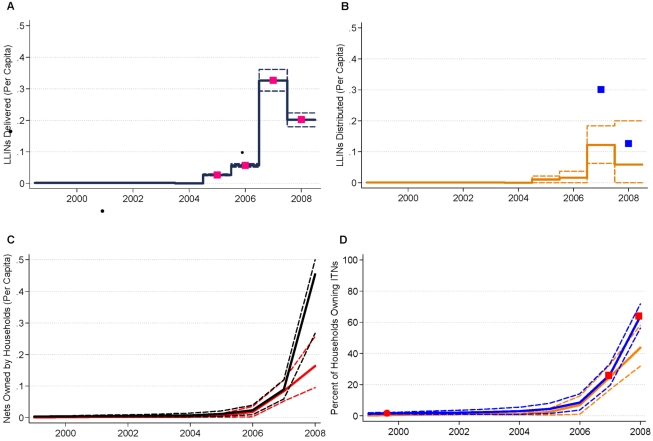
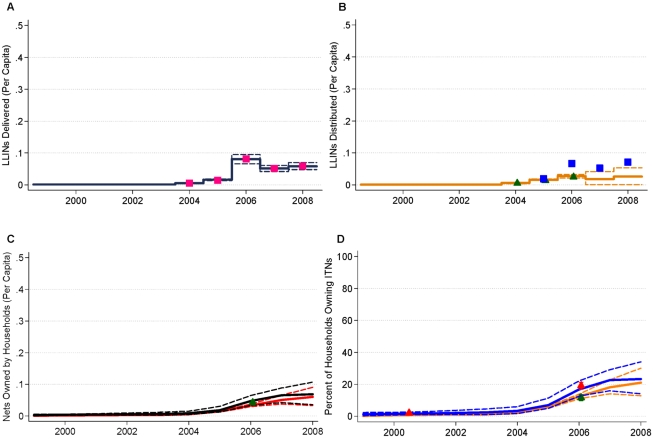
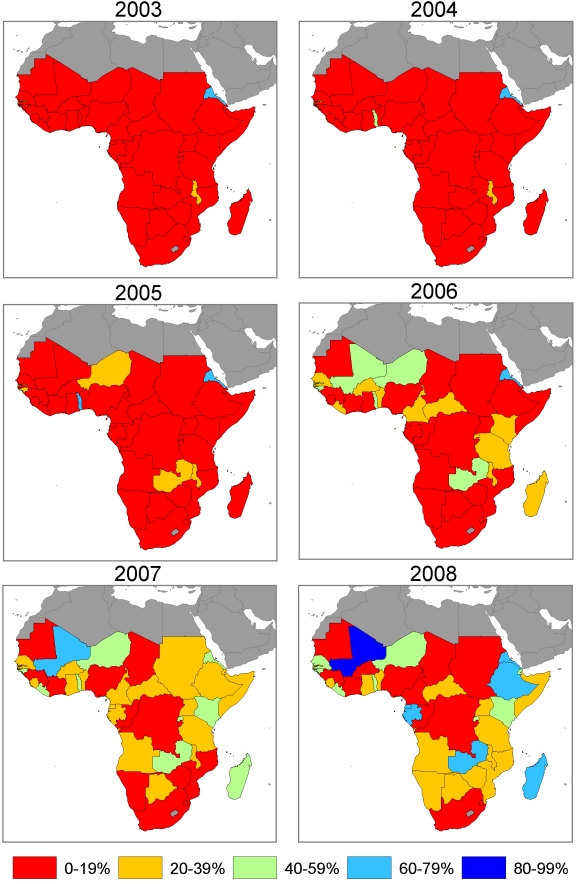
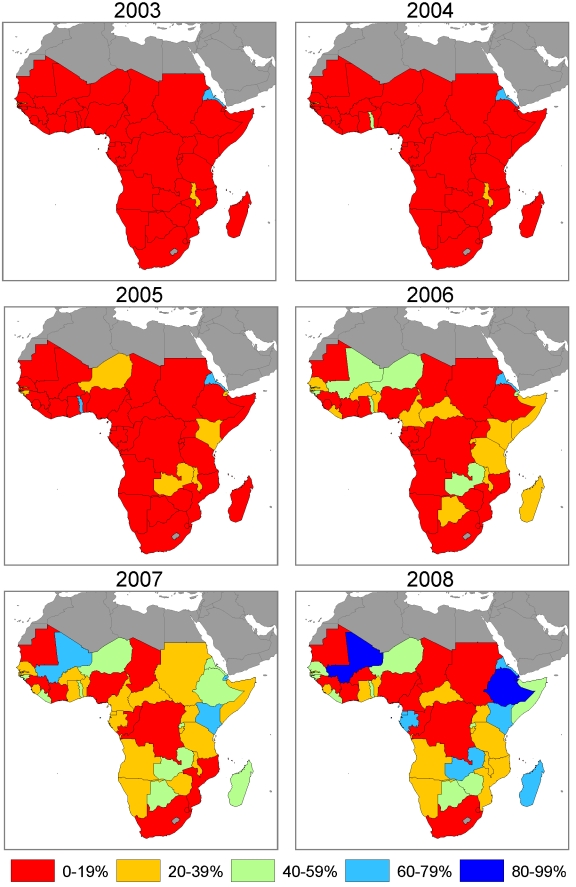
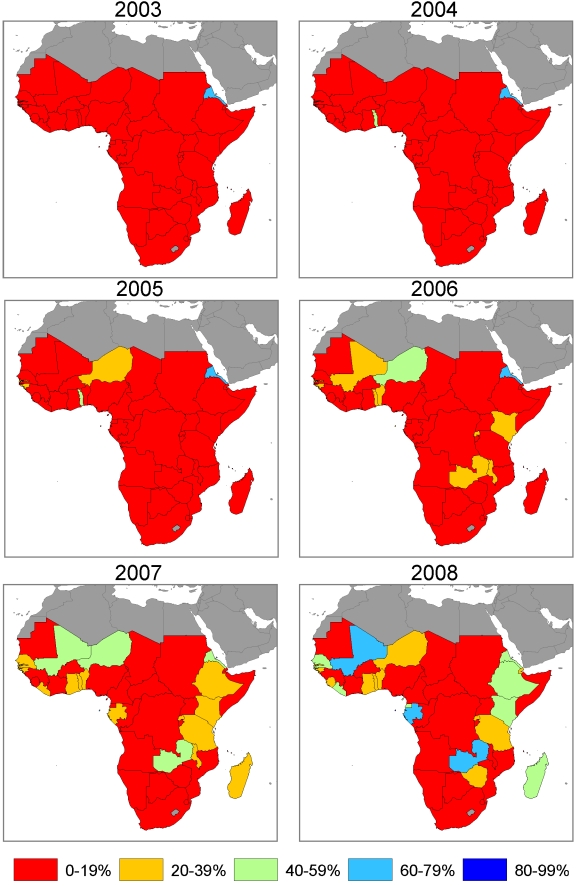
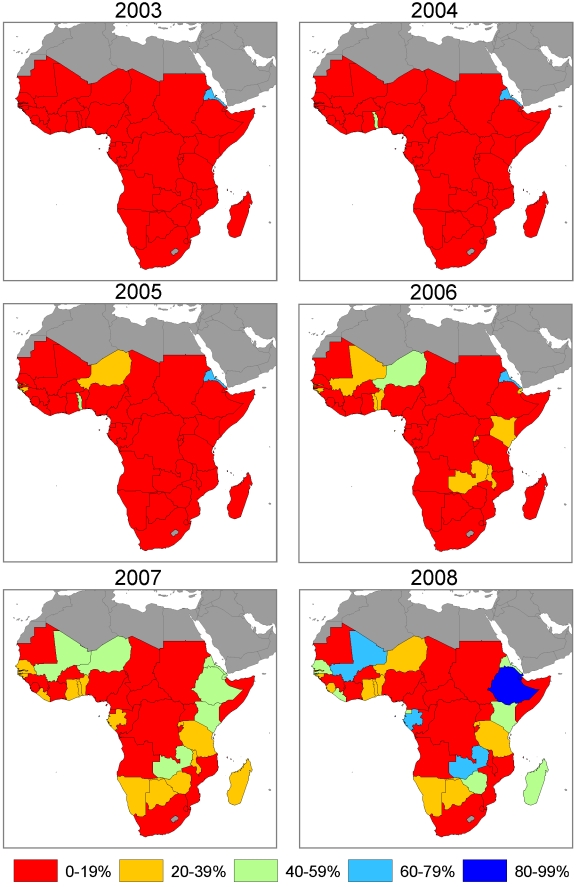
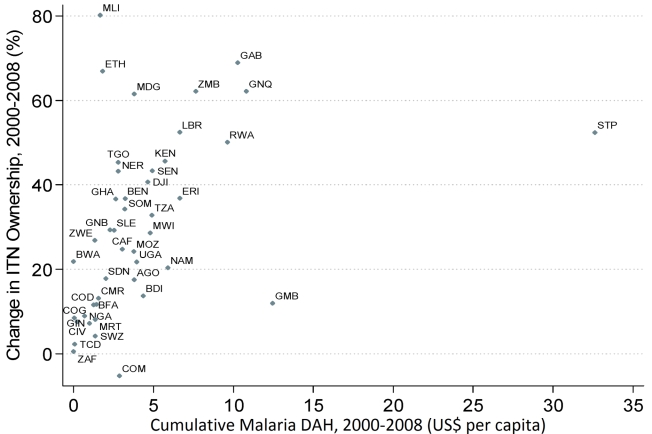
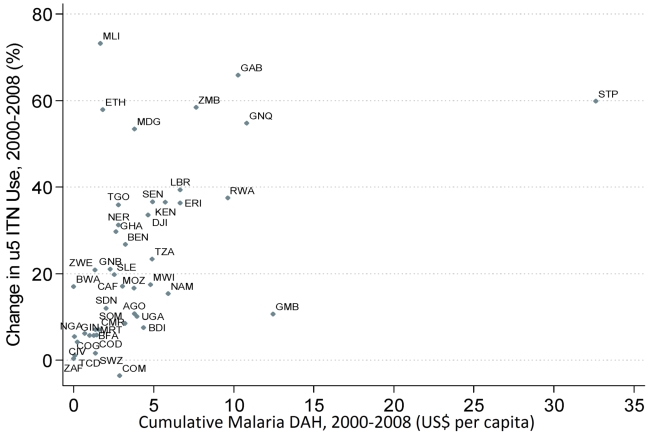
Methods and principal findings: We combined data from manufacturer reports of ITN deliveries to countries, National Malaria Control Program (NMCP) reports of ITNs distributed to health facilities and operational partners, and household survey data using Bayesian inference on a deterministic compartmental model of ITN distribution. For 44 countries in Africa, we calculated (1) ITN ownership coverage, defined as the proportion of households that own at least one ITN, and (2) ITN use in children under 5 coverage, defined as the proportion of children under the age of 5 years who slept under an ITN. Using regression, we examined the relationship between cumulative DAH targeted at malaria between 2000 and 2008 and the change in national-level ITN coverage over the same time period. In 1999, assuming that all ITNs are owned and used in populations at risk of malaria, mean coverage of ITN ownership and use in children under 5 among populations at risk of malaria were 2.2% and 1.5%, respectively, and were uniformly low across all 44 countries. In 2003, coverage of ITN ownership and use in children under 5 was 5.1% (95% uncertainty interval 4.6% to 5.7%) and 3.7% (2.9% to 4.9%); in 2006 it was 17.5% (16.4% to 18.8%) and 12.9% (10.8% to 15.4%); and by 2008 it was 32.8% (31.4% to 34.4%) and 26.6% (22.3% to 30.9%), respectively. In 2008, four countries had ITN ownership coverage of 80% or greater; six countries were between 60% and 80%; nine countries were between 40% and 60%; 12 countries were between 20% and 40%; and 13 countries had coverage below 20%. Excluding four outlier countries, each US$1 per capita in malaria DAH was associated with a significant increase in ITN household coverage and ITN use in children under 5 coverage of 5.3 percentage points (3.7 to 6.9) and 4.6 percentage points (2.5 to 6.7), respectively.

Conclusions: Rapid increases in ITN coverage have occurred in some of the poorest countries, but coverage remains low in large populations at risk. DAH targeted at malaria can lead to improvements in ITN coverage; inadequate financing may be a reason for lack of progress in some countries. Please see later in the article for the Editors' Summary.


Conflict of interest statement

MM is employed by the US Centers for Disease Control and Prevention and is funded by the US President's Malaria Initiative.

Figures

Figure 1
Figure 1. Survey and survey report availability by country and year for household ITN ownership.
Solid circles indicate surveys with micro-data available; non-solid circles indicate surveys with estimates available from survey reports.
Figure 2
Figure 2. Survey and survey report availability by country and year for under-5 ITN use.
Solid circles indicate surveys with micro-data available; non-solid circles indicate surveys with estimates available from survey reports.
Figure 3
Figure 3. Stock-and-flow model of the LLIN distribution system within a country.
μc,t indicates the number of LLINs supplied to country c by manufacturers during year t; ψc,t indicates the number of LLINs available for distribution or purchase that are in a country c in year t but are not in households, e.g. in warehouses, retail stores; δc,t indicates the number of LLINs that are received or purchased by households in country c during year t; θ1,c,t indicates the number of 0- to 1-year-old LLINs in households in country c during year t; θ2,c,t indicates the number of 1- to 2-year-old LLINs in households in country c during year t; θ3,c,t indicates the number of 2- to 3-year-old LLINs in households in country c during year t; λ1,c,t indicates the number of 0- to 1-year-old LLINs discarded by households in country c during year t; λ2,c,t indicates the number of 1- to 2-year-old LLINs discarded by households in country c during year t; λ3,c,t indicates the number of 2- to 3-year-old LLINs discarded by households in country c during year t.
Figure 4
Figure 4. Data and model estimates for Equatorial Guinea at the national level.
(A) LLINs per capita delivered to countries. Data are from manufacturer reports (pink squares). Model estimates with 95% uncertainty intervals are shown as black lines; (B) LLINs per capita distributed. Data are from National Malaria Control Program reports (blue squares). Model estimates with 95% uncertainty intervals are shown as orange lines; (C) ITNs and LLINs per capita in households. Model estimates with 95% uncertainty intervals are shown as black lines for ITNs and red lines for LLINs; (D) ITN and LLIN ownership coverage. Data are predicted from under 5 use coverage from surveys (red circles for ITN coverage); and from survey reports from countries to WHO (red squares for ITN coverage). Model estimates with 95% uncertainty intervals are shown as blue lines for ITNs, orange lines for LLINs. Years indicate the mid-point of the calendar year.
Figure 5
Figure 5. Data and model estimates for Uganda at the national level.
(A) LLINs per capita delivered to countries. Data are from manufacturer reports (pink squares). Model estimates with 95% uncertainty intervals are shown as black lines; (B) LLINs per capita distributed. Data are from National Malaria Control Program reports (blue squares); and calculated from surveys (green triangles). Model estimates with 95% uncertainty intervals are shown as orange lines; (C) ITNs and LLINs per capita in households. Data are calculated from surveys (green triangles for LLINs). Model estimates with 95% uncertainty intervals are shown as black lines for ITNs and red lines for LLINs; (D) ITN and LLIN ownership coverage. Data are calculated from survey data (green triangles for LLIN coverage, red triangles for ITN coverage). Model estimates with 95% uncertainty intervals are shown as blue lines for ITNs, orange lines for LLINs. Years indicate the mid-point of the calendar year.
Figure 6
Figure 6. Annual maps of ITN household ownership coverage at the national level in 44 African countries.
Figure 7
Figure 7. Annual maps of ITN household ownership coverage among the population at risk of malaria in 44 African countries.
Coverage is estimated in the population at risk of malaria by assuming that ITNs are owned only in populations that are at risk of malaria.
Figure 8
Figure 8. Annual maps of ITN use in children under 5 coverage at the national level in 44 African countries.
Figure 9
Figure 9. Annual maps of ITN use in children under 5 coverage among the population at risk of malaria in 44 African countries.
Coverage is estimated in the population at risk of malaria by assuming that ITNs are used only in populations that are at risk of malaria.
Figure 10
Figure 10. Relationship between cumulative DAH targeted at malaria (2000 to 2008) and the change in national-level ITN household ownership coverage (2000 to 2008).
Full country names for the abbreviations are provided in Table S2.
Figure 11
Figure 11. Relationship between cumulative DAH targeted at malaria (2000 to 2008) and the change in national-level ITN use in children under 5 coverage (2000 to 2008).
Full country names for the abbreviations are provided in Table S2.

References

    1. WHO. World Malaria Report. Geneva: WHO; 2008.
    1. Ravishankar N, Gubbins P, Cooley RJ, Leach-Kemon K, Michaud CM, et al. Financing of global health: tracking development assistance for health from 1990 to 2007. Lancet. 2009;373:2113–24. - PubMed
    1. Snow RW, Guerra CA, Mutheu JJ, Hay SI. International Funding for Malaria Control in Relation to Populations at Risk of Stable Plasmodium falciparum Transmission. PLoS Med. 2008;5:e142. doi: 10.1371/journal.pmed.0050142. - DOI - PMC - PubMed
    1. Lengeler C. Insecticide-treated net bednet and curtains for preventing malaria. Cochrane Database Syst Rev. 2004;2:CD000363. doi: 10.1002/14651858.CD000363.pub2. - DOI - PubMed
    1. RBM Partnership. Global Strategic Plan: Roll Back Malaria 2005–2015. Geneva: RBM Partnership Secretariat; 2005.

Publication types