. 2010 Aug 17;5(8):e12106.
doi: 10.1371/journal.pone.0012106.

Limited systemic sclerosis patients with pulmonary arterial hypertension show biomarkers of inflammation and vascular injury

Affiliations

Limited systemic sclerosis patients with pulmonary arterial hypertension show biomarkers of inflammation and vascular injury

Sarah A Pendergrass et al. PLoS One. .

Abstract

Background: Pulmonary arterial hypertension (PAH) is a common complication for individuals with limited systemic sclerosis (lSSc). The identification and characterization of biomarkers for lSSc-PAH should lead to less invasive screening, a better understanding of pathogenesis, and improved treatment.

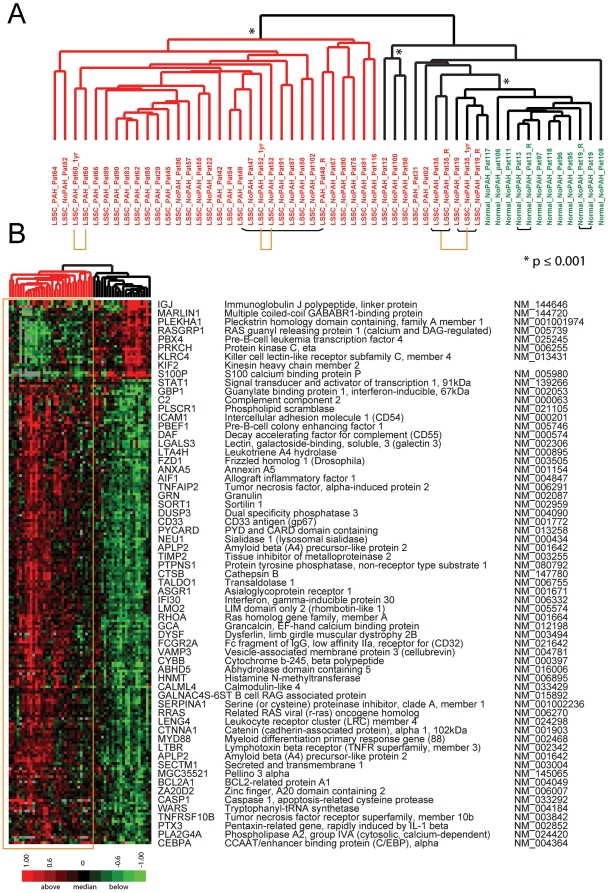
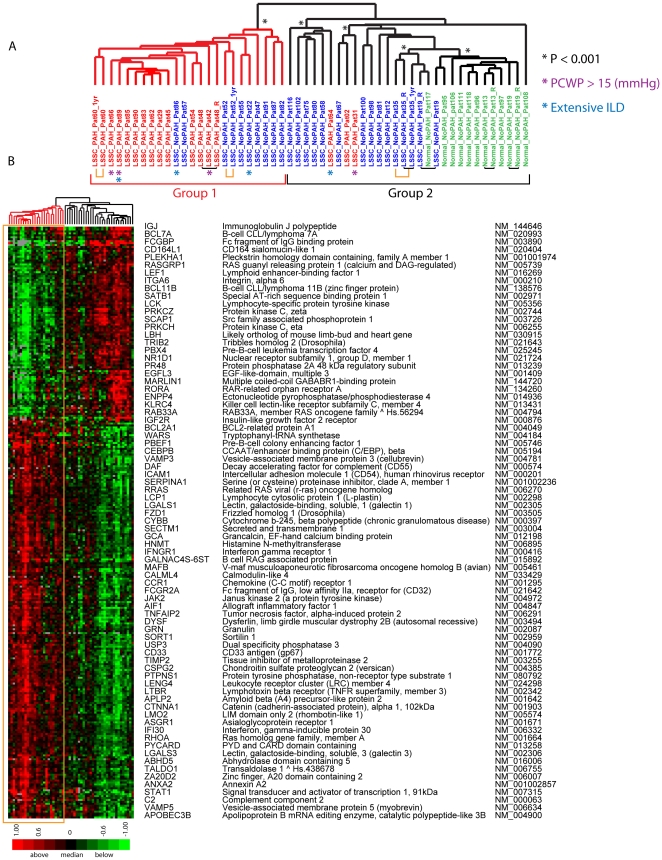
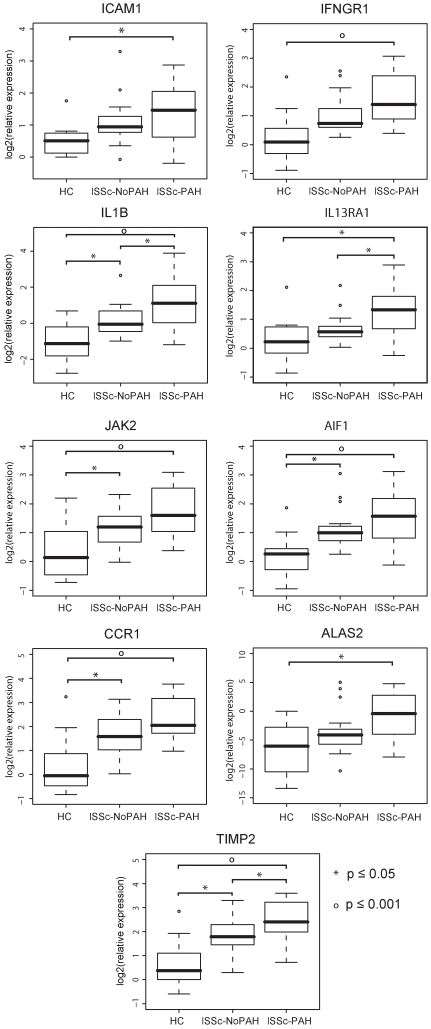
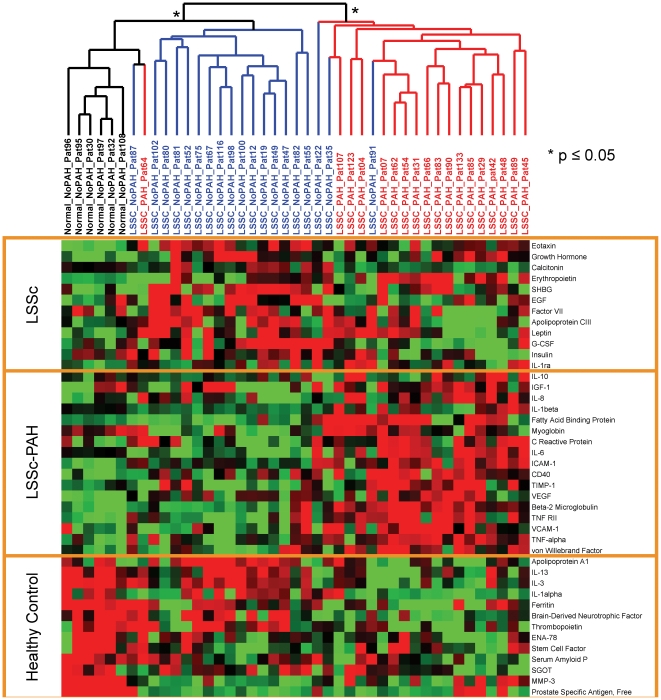
Methods and findings: Forty-nine PBMC samples were obtained from 21 lSSc subjects without PAH (lSSc-noPAH), 15 lSSc subjects with PAH (lSSc-PAH), and 10 healthy controls; three subjects provided PBMCs one year later. Genome-wide gene expression was measured for each sample. The levels of 89 cytokines were measured in serum from a subset of subjects by Multi-Analyte Profiling (MAP) immunoassays. Gene expression clearly distinguished lSSc samples from healthy controls, and separated lSSc-PAH from lSSc-NoPAH patients. Real-time quantitative PCR confirmed increased expression of 9 genes (ICAM1, IFNGR1, IL1B, IL13Ra1, JAK2, AIF1, CCR1, ALAS2, TIMP2) in lSSc-PAH patients. Increased circulating cytokine levels of inflammatory mediators such as TNF-alpha, IL1-beta, ICAM-1, and IL-6, and markers of vascular injury such as VCAM-1, VEGF, and von Willebrand Factor were found in lSSc-PAH subjects.

Conclusions and significance: The gene expression and cytokine profiles of lSSc-PAH patients suggest the presence of activated monocytes, and show markers of vascular injury and inflammation. These genes and factors could serve as biomarkers of PAH involvement in lSSc.


Conflict of interest statement

Competing Interests: The authors have declared that no competing interests exist.

Figures

Figure 1
Figure 1. Gene expression differentiates lSSc PBMC samples from healthy controls.
A. Clustering dendrogram using 206 probes that most differentiated lSSc (red identifiers) and healthy control samples (green identifiers; FDR cutoff<0.18%). Black bars beneath the sample identifiers connect technical replicates. Samples collected one year apart are indicated by yellow bars. Asterisks indicate statistically significant clustering determined by SigClust. The red dendrogram branch contains the majority of lSSc samples, and the black branch contains those lSSc samples most like healthy controls. B. Heat map showing expression of the 206 probes after 2-dimensional hierarchical clustering. Expression values above the mean for each probe are indicated in red and below the mean are indicated in green. The yellow box highlights the gene expression data for the dendrogram branch containing the majority of lSSc samples. A subset of genes is listed next to the heat map. The full figure with all probe names is available as Figure S1.
Figure 2
Figure 2. Gene expression differentiating lSSc-PAH, lSSc-noPAH and healthy controls.
A. Hierarchical clustering dendrogram generated using 305 probes selected by a multi-group SAM analysis (FDR<0.14%). LSSc-PAH sample identifiers are indicated in red, lSSc-NoPAH in blue, and healthy controls in green. Black bars connect technical replicates and yellow bars connect samples collected one year apart. Statistically significant branches determined by SigClust are indicated. The major bifurcation in the dendrogram divides Group 1 and Group 2. B. Heat map showing the expression values of the 305 probes after 2-dimensional hierarchical clustering. Gene expression ratios are colored as in Figure 1. The yellow box highlights the gene expression of Group 1, which contains most of the lSSc-PAH PBMC samples. A subset of genes from the 305 probes are listed. The full figure with all probe names is available as Supplementary Figure S2. Patients with PCWP >15 (mm Hg) are indicated with a purple asterisk (*) and those with extensive ILD are indicated with a blue asterisk (*). The analysis was repeated without these patients and nearly identical groupings were obtained (Figure S3).
Figure 3
Figure 3. Quantitative Real Time PCR validation of gene expression.
RT-PCR validation was performed for nine genes (ICAM1, IFNγR1, IL1B, IL13Rα1, JAK2, AIF1, CCR1, ALAS2, TIMP2) in healthy control, lSSc-NoPAH, and lSSc-PAH samples. Bars indicate comparisons with statistically significant differential expression. Symbols indicate the level of significance between groups (asterisks p≤0.05, open circles p≤0.001).
Figure 4
Figure 4. Distribution of PAH assessment measures between gene expression groups.
‘Group 1’ and ‘Group 2’ were defined by the major bifurcation in the clustering dendrogram of figure 2, with Group 1 containing all lSSc-PAH samples but three, and Group 2 containing all of the healthy control samples. Solid circles indicate PAH measures from lSSc-PAH patients, open circles indicate those from lSSc-NoPAH patients. A. mPAP measurements compared between patients in Group1 versus those in Group 2. B. DLCO values compared between Group 1 and Group 2.
Figure 5
Figure 5. A subset of cytokines shows association with lSSc and lSSc-PAH.
A MAP panel was used to profile the cytokines in plasma from lSSc-PAH, lSSc-NoPAH, and healthy control samples. Cytokines with significantly different levels between the three groups were selected using a multiclass SAM analysis (FDR<4.93%). 42 cytokines were selected and organized by 2 dimensional hierarchical clustering. The dendrogram shows lSSc-PAH (red), lSSc-NoPAH (blue), and healthy controls (black) group distinctly. Asterisks indicate stable groups as determined by SigClust. Increasing brightness of red indicates relative fold change increase in cytokine levels. Increasing brightness for green pixels indicates decreasing cytokine levels. Yellow boxes highlight the cytokines with increased levels in the three major groups, lSSc-PAH, lSSc regardless of PAH status, and healthy controls.

References

    1. Steen V, Medsger TA., Jr Predictors of isolated pulmonary hypertension in patients with systemic sclerosis and limited cutaneous involvement. Arthritis Rheum. 2003;48:516–522. - PubMed
    1. Bull TM. Screening and therapy of pulmonary hypertension in systemic sclerosis. Curr Opin Rheumatol. 2007;19:598–603. - PubMed
    1. Steen VD. Scleroderma renal crisis. Rheum Dis Clin North Am. 1996;22:861–878. - PubMed
    1. Carmeliet P, Dor Y, Herbert JM, Fukumura D, Brusselmans K, et al. Role of HIF-1alpha in hypoxia-mediated apoptosis, cell proliferation and tumour angiogenesis. Nature. 1998;394:485–490. - PubMed
    1. Faller DV. Endothelial cell responses to hypoxic stress. Clin Exp Pharmacol Physiol. 1999;26:74–84. - PubMed

Publication types

MeSH terms