

Demographic differences in incidence for pituitary adenoma
- PMID: 20809113
- PMCID: PMC3652258
- DOI: 10.1007/s11102-010-0253-4
Demographic differences in incidence for pituitary adenoma
Abstract
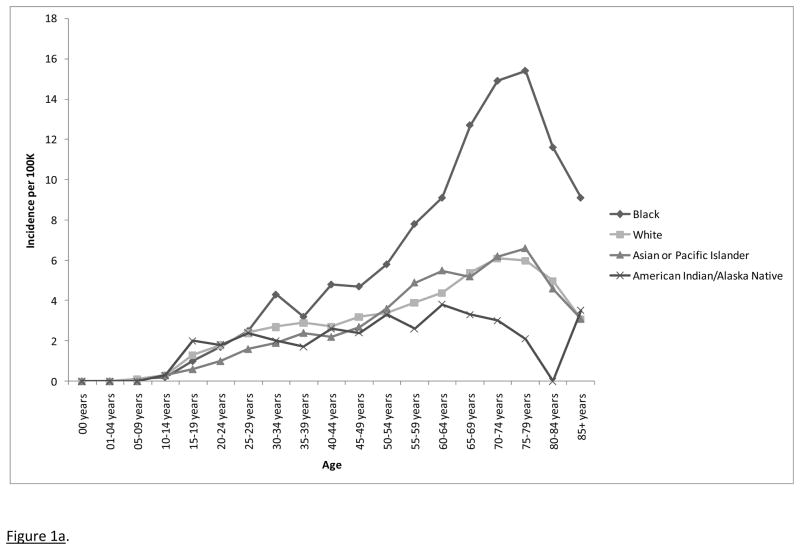
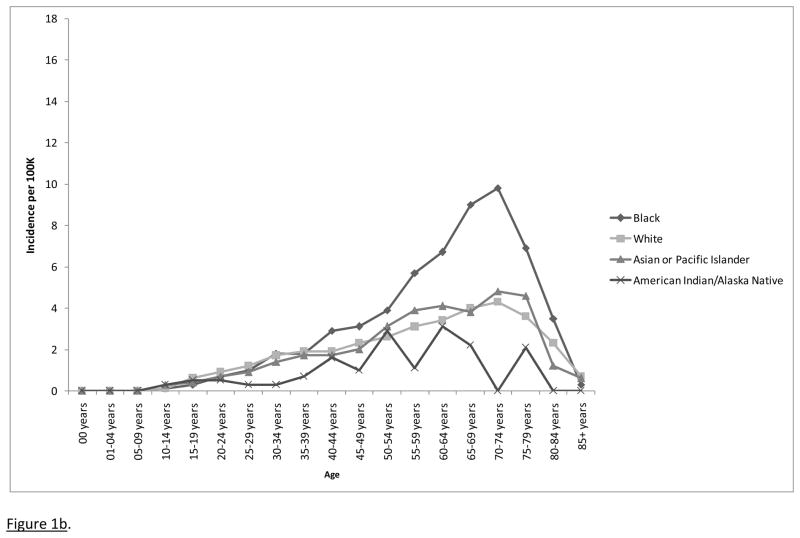
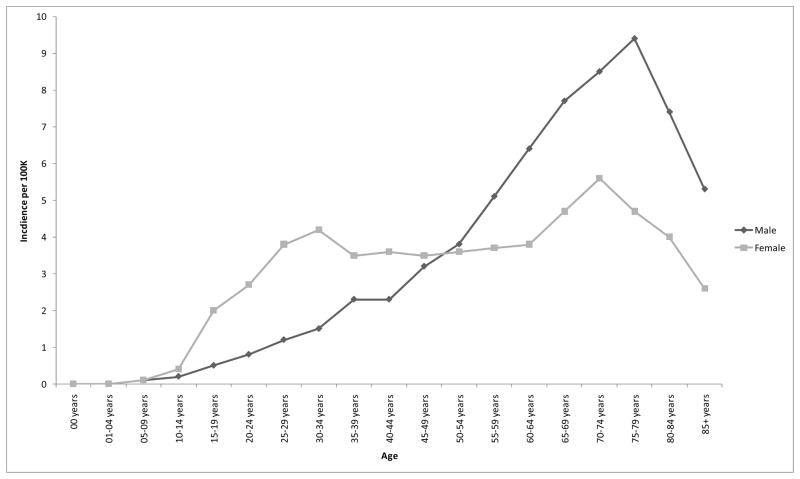
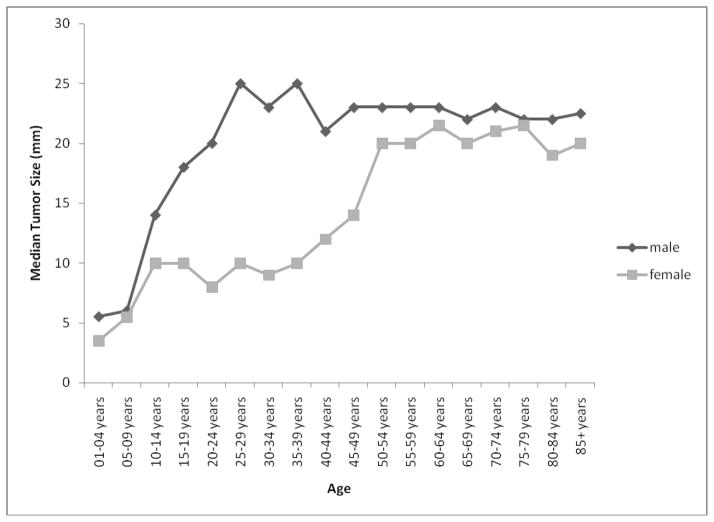
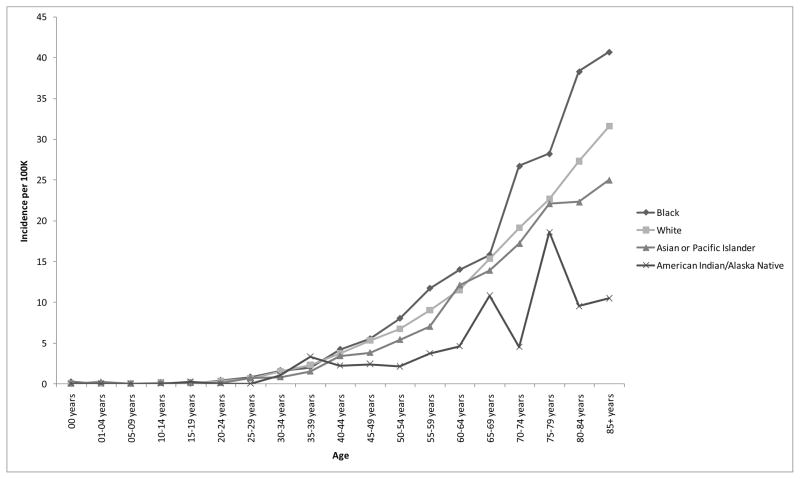
Incidence estimates for pituitary adenomas vary widely, suggesting the effects of numerous risk factors or varying levels of tumor surveillance. We studied the epidemiology of pituitary adenomas using 2004-2007 data collected by 17 Surveillance, Epidemiology, and End Results Programs in the United States (N = 8,276). We observed that incidence rates generally increased with age and were higher in females in early life and higher in males in later life. Males are diagnosed with larger tumors on average than females. Diagnosis may be delayed for males, giving tumors a chance to grow larger before clinical detection. We also observed that American Blacks have higher incidence rates for pituitary adenomas compared with other ethnic groups. There are several potential explanations for this finding with some evidence that at least part of the effect may be due to differential diagnosis between races.
Figures
References
-
- Buurman H, Saeger W. Subclinical adenomas in postmortem pituitaries: Classification and correlations to clinical data. Eur J Endocrinol. 2006;154:753–758. - PubMed
-
- Yamada S. Epidemiology of pituitary tumors. In: Thapar K, Kovacs K, Scheithauer BW, Lloyd RV, editors. Diagnosis and management of pituitary tumors. Humana Press, Inc; Totowa, NJ: 2001.
-
- Hemminki K, Försti A, Ji J. Incidence and familial risks in pituitary adenoma and associated tumors. Endocr Relat Cancer. 2007;14:103–109. - PubMed
Publication types
MeSH terms
Grants and funding
LinkOut - more resources
Full Text Sources
Medical
