

Development of high-throughput quantitative assays for glucose uptake in cancer cell lines
- PMID: 20809209
- PMCID: PMC3627351
- DOI: 10.1007/s11307-010-0399-5
Development of high-throughput quantitative assays for glucose uptake in cancer cell lines
Abstract
Purpose: Metabolism, and especially glucose uptake, is a key quantitative cell trait that is closely linked to cancer initiation and progression. Therefore, developing high-throughput assays for measuring glucose uptake in cancer cells would be enviable for simultaneous comparisons of multiple cell lines and microenvironmental conditions. This study was designed with two specific aims in mind: the first was to develop and validate a high-throughput screening method for quantitative assessment of glucose uptake in "normal" and tumor cells using the fluorescent 2-deoxyglucose analog 2-[N-(7-nitrobenz-2-oxa-1,3-diazol-4-yl)amino]-2-deoxyglucose (2-NBDG), and the second was to develop an image-based, quantitative, single-cell assay for measuring glucose uptake using the same probe to dissect the full spectrum of metabolic variability within populations of tumor cells in vitro in higher resolution.
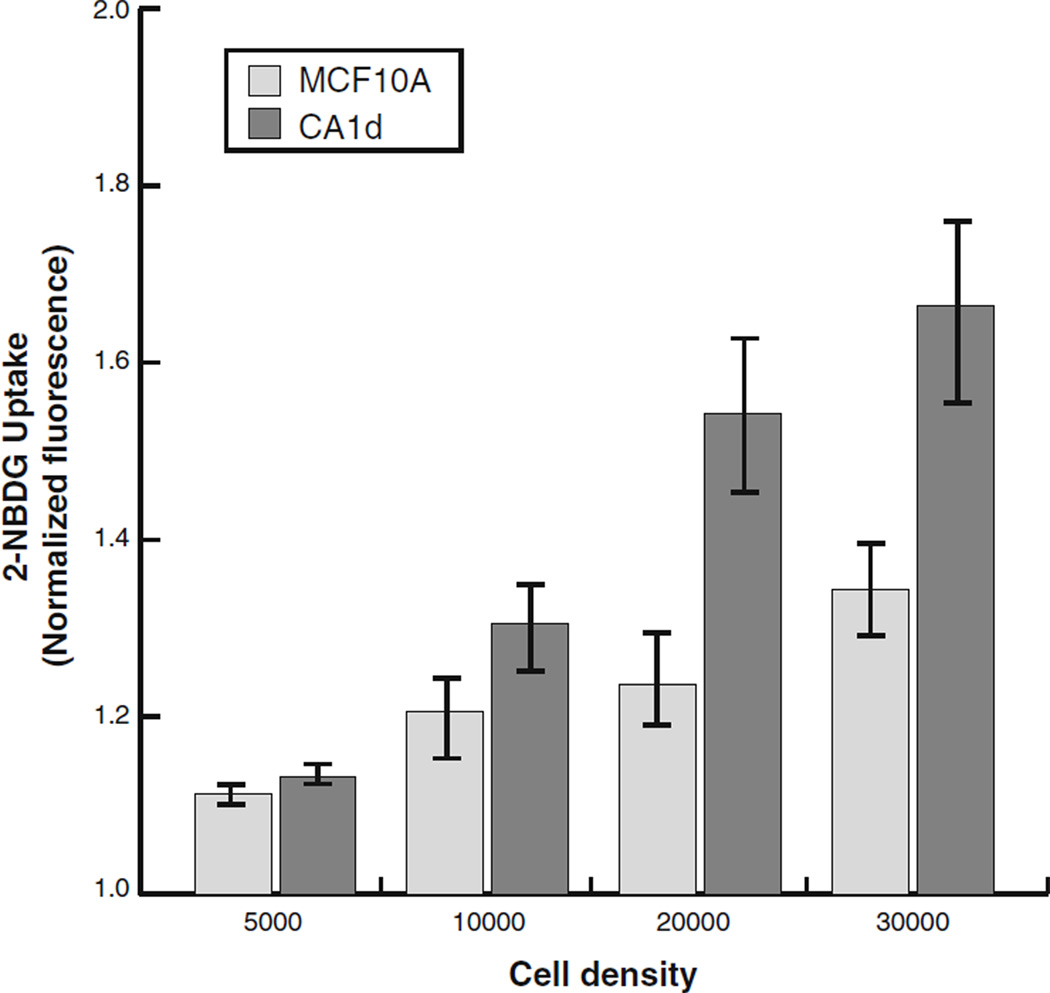
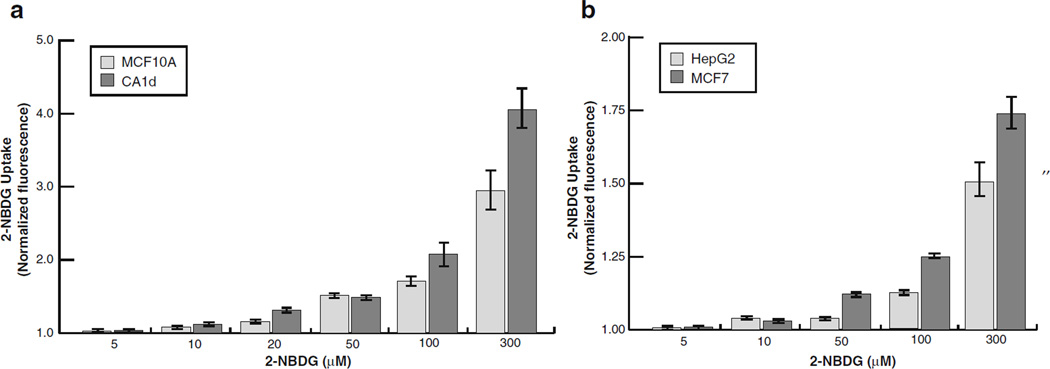
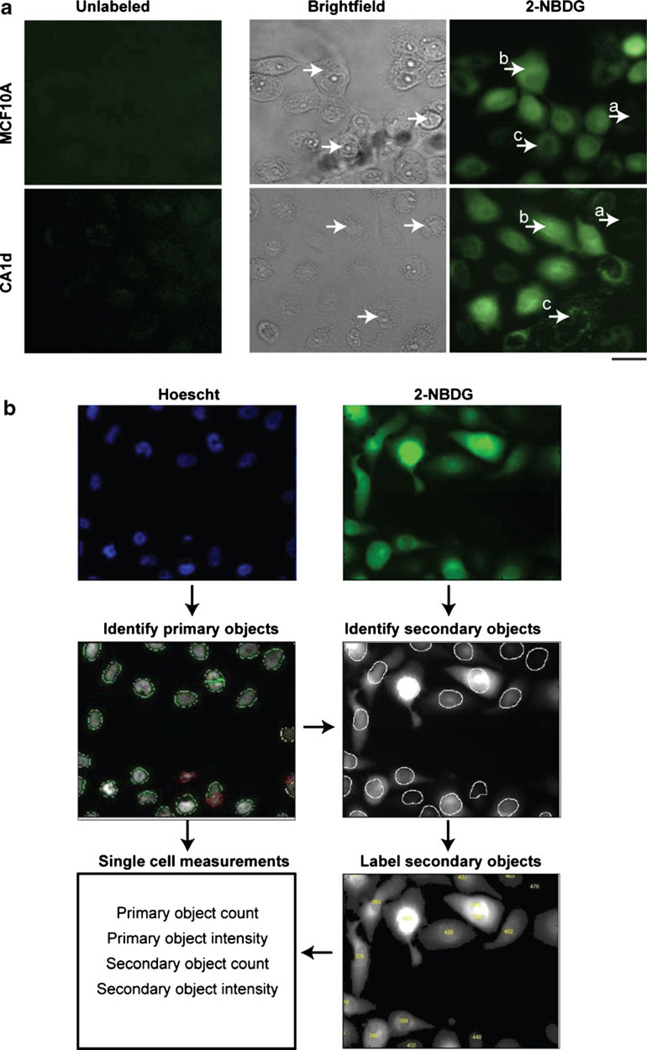
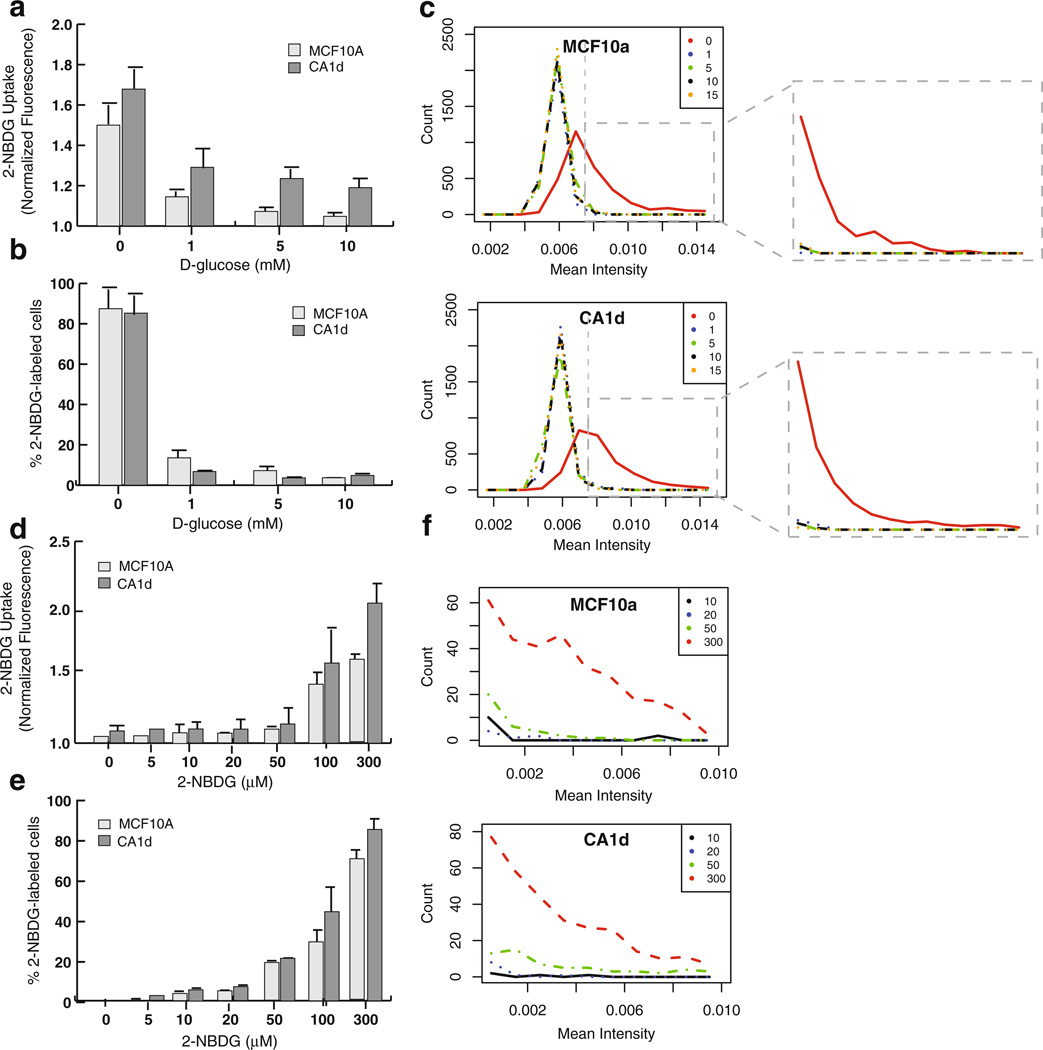
Procedure: The kinetics of population-based glucose uptake was evaluated for MCF10A mammary epithelial and CA1d breast cancer cell lines, using 2-NBDG and a fluorometric microplate reader. Glucose uptake for the same cell lines was also examined at the single-cell level using high-content automated microscopy coupled with semi-automated cell-cytometric image analysis approaches. Statistical treatments were also implemented to analyze intra-population variability.
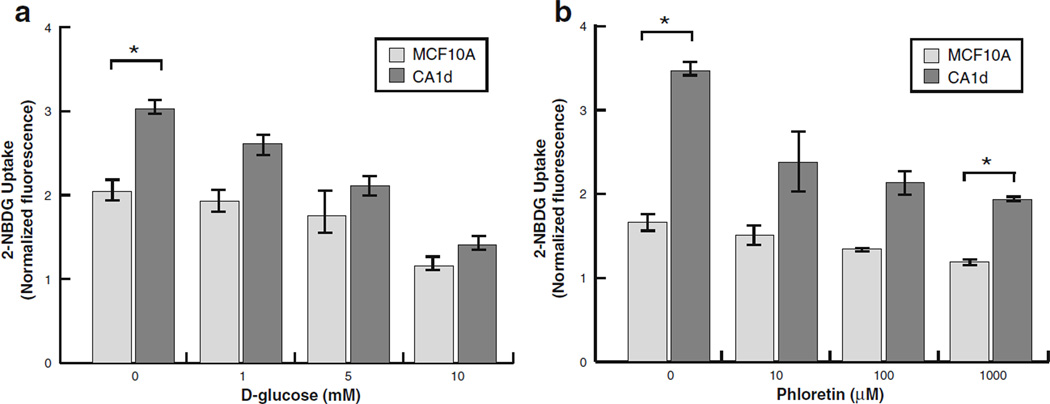
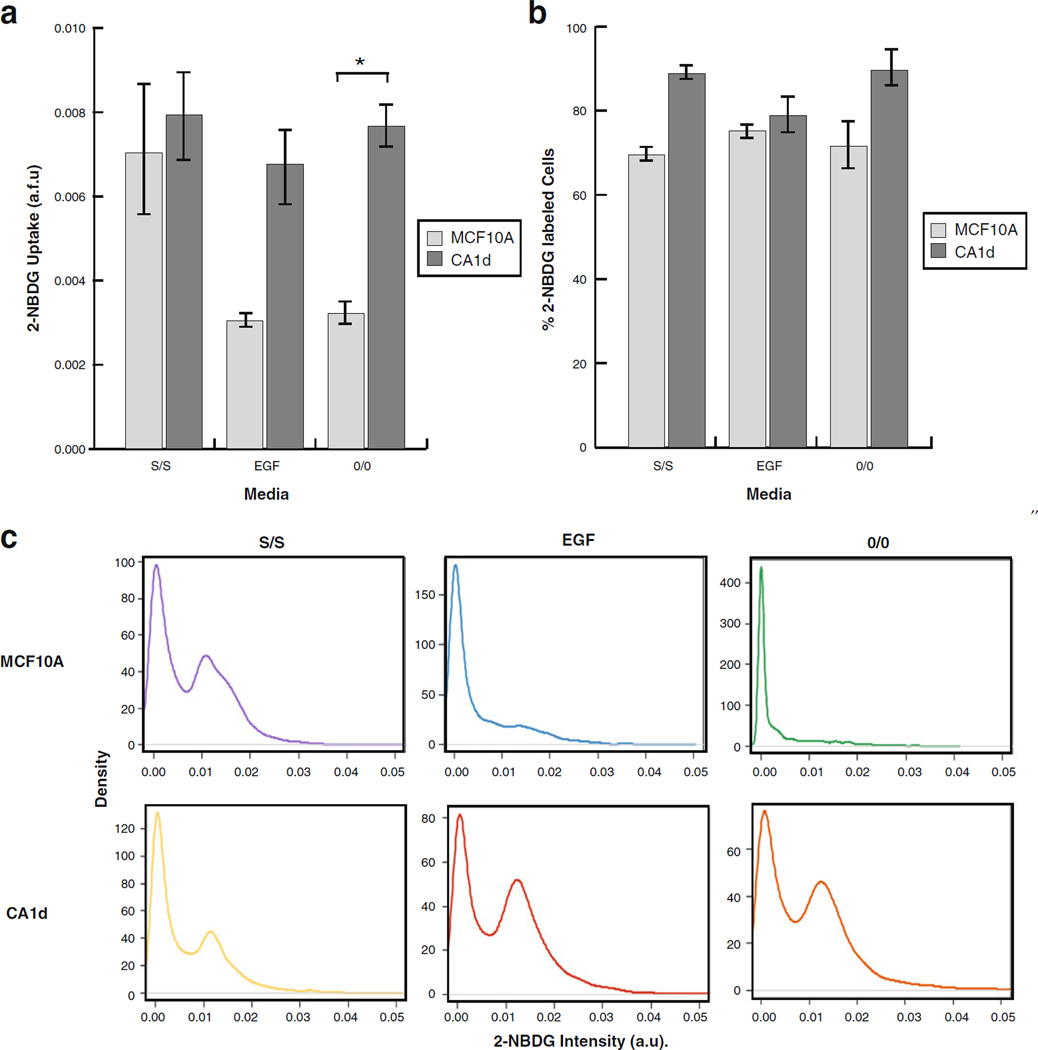
Results: Our results demonstrate that the high-throughput fluorometric assay using 2-NBDG is a reliable method to assess population-level kinetics of glucose uptake in cell lines in vitro. Similarly, single-cell image-based assays and analyses of 2-NBDG fluorescence proved an effective and accurate means for assessing glucose uptake, which revealed that breast tumor cell lines display intra-population variability that is modulated by growth conditions.
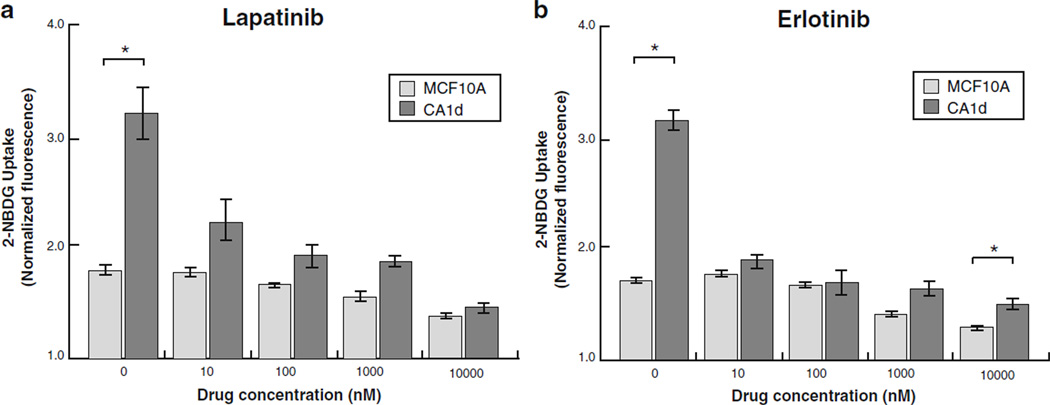
Conclusions: These studies indicate that 2-NBDG can be used to aid in the high-throughput analysis of the influence of chemotherapeutics on glucose uptake in cancer cells.
Conflict of interest statement
Figures
Similar articles
-
Uptake of a fluorescent deoxyglucose analog (2-NBDG) in tumor cells.Mol Imaging Biol. 2005 Nov-Dec;7(6):388-92. doi: 10.1007/s11307-005-0011-6. Mol Imaging Biol. 2005. PMID: 16284704
-
Uptake of 2-NBDG as a method to monitor therapy response in breast cancer cell lines.Breast Cancer Res Treat. 2011 Feb;126(1):55-62. doi: 10.1007/s10549-010-0884-1. Breast Cancer Res Treat. 2011. PMID: 20390344
-
[Uptake of 2-NBDG by human breast cancer cells in vitro].Zhonghua Zhong Liu Za Zhi. 2010 Jul;32(7):507-10. Zhonghua Zhong Liu Za Zhi. 2010. PMID: 21029693 Chinese.
-
Aberrant Uptake of a Fluorescent L-Glucose Analogue (fLG) into Tumor Cells Expressing Malignant Phenotypes.Biol Pharm Bull. 2018;41(10):1508-1516. doi: 10.1248/bpb.b18-00089. Biol Pharm Bull. 2018. PMID: 30270319 Review.
-
The Use of L-Glucose in Cancer Diagnosis: Results from In Vitro and In Vivo Studies.Curr Med Chem. 2021;28(30):6110-6122. doi: 10.2174/0929867328666210311112240. Curr Med Chem. 2021. PMID: 33719949 Review.
Cited by
-
Assessment of the Mutational Status of NSCLC Using Hypermetabolic Circulating Tumor Cells.Cancers (Basel). 2018 Aug 14;10(8):270. doi: 10.3390/cancers10080270. Cancers (Basel). 2018. PMID: 30110953 Free PMC article.
-
Glucose is a key driver for GLUT1-mediated nanoparticles internalization in breast cancer cells.Sci Rep. 2016 Feb 22;6:21629. doi: 10.1038/srep21629. Sci Rep. 2016. PMID: 26899926 Free PMC article.
-
Optical imaging provides flow-cytometry-like single-cell level analysis of HIF-1α-mediated metabolic changes in radioresistant head and neck squamous carcinoma cells.Biophotonics Discov. 2025 Jan;2(1):012702. doi: 10.1117/1.bios.2.1.012702. Epub 2025 Jan 28. Biophotonics Discov. 2025. PMID: 39917319 Free PMC article.
-
Discovery of highly potent and selective 7-ethyl-10-hydroxycamptothecin-glucose conjugates as potential anti-colorectal cancer agents.Front Pharmacol. 2022 Nov 23;13:1014854. doi: 10.3389/fphar.2022.1014854. eCollection 2022. Front Pharmacol. 2022. PMID: 36506586 Free PMC article.
-
Using a novel coculture model to dissect the role of intramuscular lipid load on skeletal muscle insulin responsiveness under reduced estrogen conditions.Am J Physiol Endocrinol Metab. 2013 Jun 1;304(11):E1199-212. doi: 10.1152/ajpendo.00617.2012. Epub 2013 Apr 2. Am J Physiol Endocrinol Metab. 2013. PMID: 23548610 Free PMC article.
References
-
- Warburg O. On the origin of cancer cells. Science. 1956;123(3191):309–314. - PubMed
-
- Tennant DA, et al. Metabolic transformation in cancer. Carcinogenesis. 2009;30(8):1269–1280. - PubMed
-
- Warburg O. On respiratory impairment in cancer cells. Science. 1956;124(3215):269–270. - PubMed
-
- Hsu PP, Sabatini DM. Cancer cell metabolism: Warburg and beyond. Cell. 2008;134(5):703–707. - PubMed
Publication types
MeSH terms
Substances
Grants and funding
LinkOut - more resources
Full Text Sources
Other Literature Sources
