

Forward-time simulation of realistic samples for genome-wide association studies
- PMID: 20809983
- PMCID: PMC2939614
- DOI: 10.1186/1471-2105-11-442
Forward-time simulation of realistic samples for genome-wide association studies
Abstract
Background: Forward-time simulations have unique advantages in power and flexibility for the simulation of genetic samples of complex human diseases because they can closely mimic the evolution of human populations carrying these diseases. However, a number of methodological and computational constraints have prevented the power of this simulation method from being fully explored in existing forward-time simulation methods.
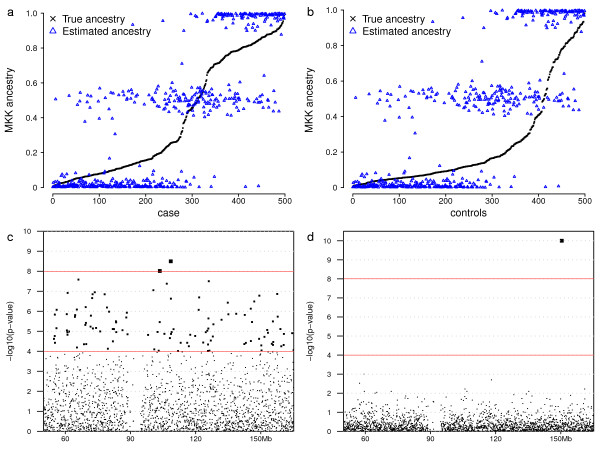
Results: Using a general-purpose forward-time population genetics simulation environment, we developed a forward-time simulation method that can be used to simulate realistic samples for genome-wide association studies. We examined the properties of this simulation method by comparing simulated samples with real data and demonstrated its wide applicability using four examples, including a simulation of case-control samples with a disease caused by multiple interacting genetic and environmental factors, a simulation of trio families affected by a disease-predisposing allele that had been subjected to either slow or rapid selective sweep, and a simulation of a structured population resulting from recent population admixture.
Conclusions: Our algorithm simulates populations that closely resemble the complex structure of the human genome, while allows the introduction of signals of natural selection. Because of its flexibility to generate different types of samples with arbitrary disease or quantitative trait models, this simulation method can simulate realistic samples to evaluate the performance of a wide variety of statistical gene mapping methods for genome-wide association studies.
Figures
Similar articles
-
Forward-time simulations of human populations with complex diseases.PLoS Genet. 2007 Mar 23;3(3):e47. doi: 10.1371/journal.pgen.0030047. Epub 2007 Feb 15. PLoS Genet. 2007. PMID: 17381243 Free PMC article.
-
GENOMEPOP: a program to simulate genomes in populations.BMC Bioinformatics. 2008 Apr 30;9:223. doi: 10.1186/1471-2105-9-223. BMC Bioinformatics. 2008. PMID: 18447924 Free PMC article.
-
A flexible forward simulator for populations subject to selection and demography.Bioinformatics. 2008 Dec 1;24(23):2786-7. doi: 10.1093/bioinformatics/btn522. Epub 2008 Oct 7. Bioinformatics. 2008. PMID: 18842601 Free PMC article.
-
An overview of population genetic data simulation.J Comput Biol. 2012 Jan;19(1):42-54. doi: 10.1089/cmb.2010.0188. Epub 2011 Dec 9. J Comput Biol. 2012. PMID: 22149682 Free PMC article. Review.
-
Genome simulation approaches for synthesizing in silico datasets for human genomics.Adv Genet. 2010;72:1-24. doi: 10.1016/B978-0-12-380862-2.00001-1. Adv Genet. 2010. PMID: 21029846 Review.
Cited by
-
SHIPS: Spectral Hierarchical clustering for the Inference of Population Structure in genetic studies.PLoS One. 2012;7(10):e45685. doi: 10.1371/journal.pone.0045685. Epub 2012 Oct 12. PLoS One. 2012. PMID: 23077494 Free PMC article.
-
Simulating realistic genomic data with rare variants.Genet Epidemiol. 2013 Feb;37(2):163-72. doi: 10.1002/gepi.21696. Epub 2012 Nov 17. Genet Epidemiol. 2013. PMID: 23161487 Free PMC article.
-
Accounting for population stratification in practice: a comparison of the main strategies dedicated to genome-wide association studies.PLoS One. 2011;6(12):e28845. doi: 10.1371/journal.pone.0028845. Epub 2011 Dec 21. PLoS One. 2011. PMID: 22216125 Free PMC article.
-
Refining the scope of genetic influences on alcohol misuse through environmental stratification and gene-environment interaction.Alcohol Clin Exp Res (Hoboken). 2024 Oct;48(10):1853-1865. doi: 10.1111/acer.15425. Epub 2024 Aug 28. Alcohol Clin Exp Res (Hoboken). 2024. PMID: 39198719
-
HAP-SAMPLE2: data-based resampling for association studies with admixture.Bioinformatics. 2025 Jun 2;41(6):btaf333. doi: 10.1093/bioinformatics/btaf333. Bioinformatics. 2025. PMID: 40512000 Free PMC article.
References
Publication types
MeSH terms
Substances
Grants and funding
LinkOut - more resources
Full Text Sources
