

How to run far: multiple solutions and sex-specific responses to selective breeding for high voluntary activity levels
- PMID: 20810439
- PMCID: PMC3025687
- DOI: 10.1098/rspb.2010.1584
How to run far: multiple solutions and sex-specific responses to selective breeding for high voluntary activity levels
Abstract
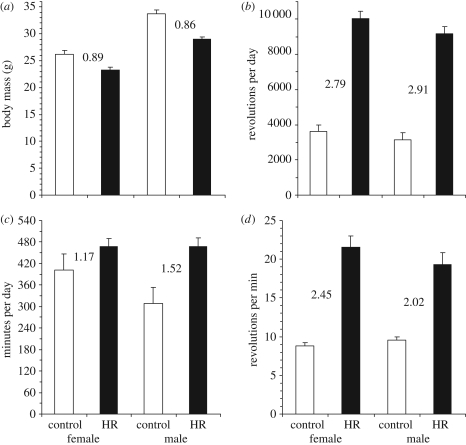
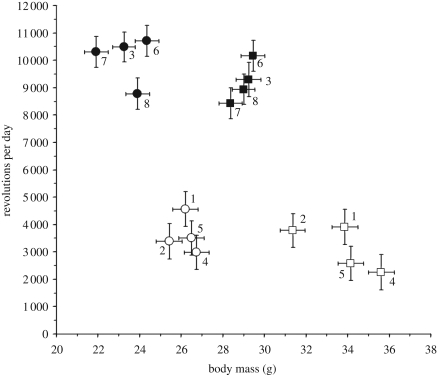
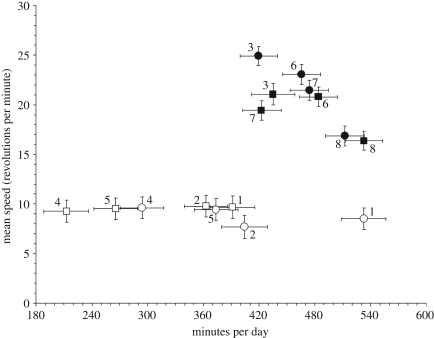
The response to uniform selection may occur in alternate ways that result in similar performance. We tested for multiple adaptive solutions during artificial selection for high voluntary wheel running in laboratory mice. At generation 43, the four replicate high runner (HR) lines averaged 2.85-fold more revolutions per day as compared with four non-selected control (C) lines, and females ran 1.11-fold more than males, with no sex-by-linetype interaction. Analysis of variance indicated significant differences among C lines but not among HR for revolutions per day. By contrast, average speed varied significantly among HR lines, but not among C, and showed a sex-by-linetype interaction, with the HR/C ratio being 2.02 for males and 2.45 for females. Time spent running varied among both HR and C lines, and showed a sex-by-linetype interaction, with the HR/C ratio being 1.52 for males but only 1.17 for females. Thus, females (speed) and males (speed, but also time) evolved differently, as did the replicate selected lines. Speed and time showed a trade-off among HR but not among C lines. These results demonstrate that uniform selection on a complex trait can cause consistent responses in the trait under direct selection while promoting divergence in the lower-level components of that trait.
Figures
References
-
- Bock W. J. 1959. Preadaptation and multiple evolutionary pathways. Evolution 13, 194–21110.2307/2405873 (doi:10.2307/2405873) - DOI - DOI
-
- Mayr E. 1961. Cause and effect in biology. Science 134, 1501–150610.1126/science.134.3489.1501 (doi:10.1126/science.134.3489.1501) - DOI - DOI - PubMed
-
- Irschick D. J., Herrel A., Vanhooydonck B. 2006. Whole-organism studies of adhesion in pad-bearing lizards: creative evolutionary solutions to functional problems. J. Comp. Physiol. A 192, 1169–117710.1007/s00359-006-0145-2 (doi:10.1007/s00359-006-0145-2) - DOI - DOI - PubMed
-
- Harvey P. H., Pagel M. D. 1991. The comparative method in evolutionary biology. Oxford, UK: Oxford University Press
-
- Middleton K. M., Gatesy S. M. 2000. Theropod forelimb design and evolution. Zool. J. Linn. Soc. 128, 149–18710.1111/j.1096-3642.2000.tb00160.x (doi:10.1111/j.1096-3642.2000.tb00160.x) - DOI - DOI
Publication types
MeSH terms
LinkOut - more resources
Full Text Sources
Miscellaneous
