

Metformin prevents tobacco carcinogen--induced lung tumorigenesis
- PMID: 20810672
- PMCID: PMC3192328
- DOI: 10.1158/1940-6207.CAPR-10-0055
Metformin prevents tobacco carcinogen--induced lung tumorigenesis
Abstract
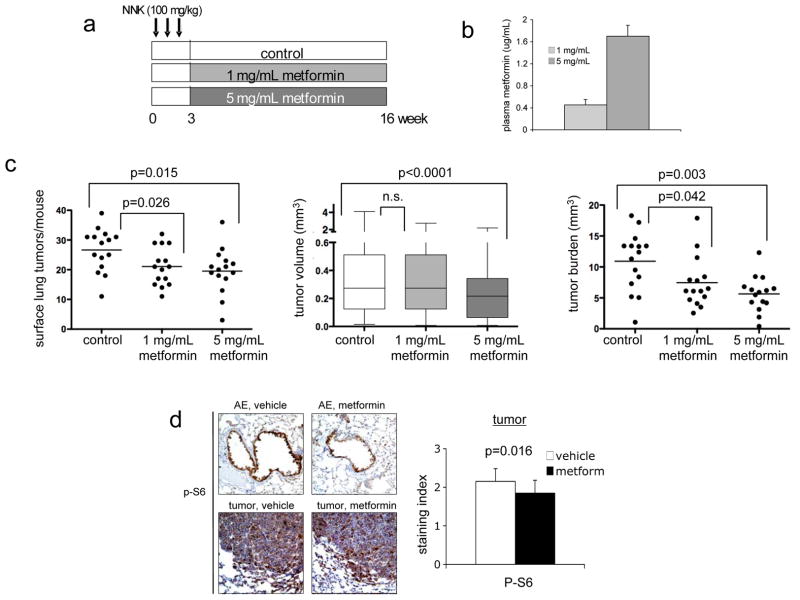
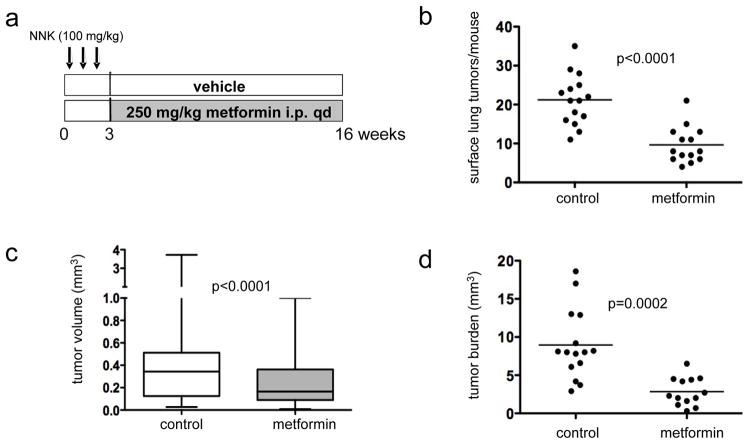
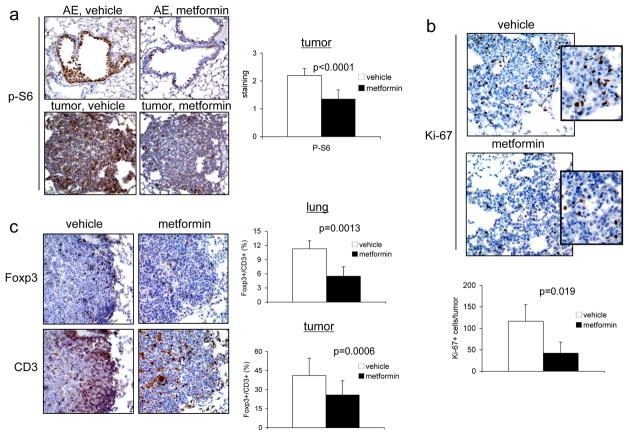
Activation of the mammalian target of rapamycin (mTOR) pathway is an important and early event in tobacco carcinogen-induced lung tumorigenesis, and therapies that target mTOR could be effective in the prevention or treatment of lung cancer. The biguanide metformin, which is widely prescribed for the treatment of type II diabetes, might be a good candidate for lung cancer chemoprevention because it activates AMP-activated protein kinase (AMPK), which can inhibit the mTOR pathway. To test this, A/J mice were treated with oral metformin after exposure to the tobacco carcinogen 4-(methylnitrosamino)-1-(3-pyridyl)-1-butanone (NNK). Metformin reduced lung tumor burden by up to 53% at steady-state plasma concentrations that are achievable in humans. mTOR was inhibited in lung tumors but only modestly. To test whether intraperitoneal administration of metformin might improve mTOR inhibition, we injected mice and assessed biomarkers in liver and lung tissues. Plasma levels of metformin were significantly higher after injection than oral administration. In liver tissue, metformin activated AMPK and inhibited mTOR. In lung tissue, metformin did not activate AMPK but inhibited phosphorylation of insulin-like growth factor-I receptor/insulin receptor (IGF-1R/IR), Akt, extracellular signal-regulated kinase (ERK), and mTOR. This suggested that metformin indirectly inhibited mTOR in lung tissue by decreasing activation of insulin-like growth factor-I receptor/insulin receptor and Akt upstream of mTOR. Based on these data, we repeated the NNK-induced lung tumorigenesis study using intraperitoneal administration of metformin. Metformin decreased tumor burden by 72%, which correlated with decreased cellular proliferation and marked inhibition of mTOR in tumors. These studies show that metformin prevents tobacco carcinogen-induced lung tumorigenesis and support clinical testing of metformin as a chemopreventive agent.
Figures


Comment in
-
Chemoprevention meets glucose control.Cancer Prev Res (Phila). 2010 Sep;3(9):1049-52. doi: 10.1158/1940-6207.CAPR-10-0178. Epub 2010 Sep 1. Cancer Prev Res (Phila). 2010. PMID: 20810671
Similar articles
-
Inhibition of lung tumorigenesis by metformin is associated with decreased plasma IGF-I and diminished receptor tyrosine kinase signaling.Cancer Prev Res (Phila). 2013 Aug;6(8):801-10. doi: 10.1158/1940-6207.CAPR-13-0058-T. Epub 2013 Jun 14. Cancer Prev Res (Phila). 2013. PMID: 23771523 Free PMC article.
-
Identification of a highly effective rapamycin schedule that markedly reduces the size, multiplicity, and phenotypic progression of tobacco carcinogen-induced murine lung tumors.Clin Cancer Res. 2007 Apr 1;13(7):2281-9. doi: 10.1158/1078-0432.CCR-06-2570. Clin Cancer Res. 2007. PMID: 17404113
-
Early and delayed intervention with rapamycin prevents NNK-induced lung adenocarcinoma in A/J mice.Oncol Rep. 2015 Dec;34(6):2925-34. doi: 10.3892/or.2015.4277. Epub 2015 Sep 16. Oncol Rep. 2015. PMID: 26397133 Free PMC article.
-
Metformin for lung cancer prevention and improved survival: a novel approach.Eur J Cancer Prev. 2019 Jul;28(4):311-315. doi: 10.1097/CEJ.0000000000000442. Eur J Cancer Prev. 2019. PMID: 29481337 Review.
-
Chemoprevention by isothiocyanates.J Cell Biochem Suppl. 1995;22:195-209. doi: 10.1002/jcb.240590825. J Cell Biochem Suppl. 1995. PMID: 8538199 Review.
Cited by
-
Metformin use and lung cancer risk in patients with diabetes.Cancer Prev Res (Phila). 2015 Feb;8(2):174-9. doi: 10.1158/1940-6207.CAPR-14-0291. Cancer Prev Res (Phila). 2015. PMID: 25644512 Free PMC article.
-
Cellular and molecular mechanisms of metformin: an overview.Clin Sci (Lond). 2012 Mar;122(6):253-70. doi: 10.1042/CS20110386. Clin Sci (Lond). 2012. PMID: 22117616 Free PMC article. Review.
-
Chronic obstructive pulmonary disease and glucose metabolism: a bitter sweet symphony.Cardiovasc Diabetol. 2012 Oct 27;11:132. doi: 10.1186/1475-2840-11-132. Cardiovasc Diabetol. 2012. PMID: 23101436 Free PMC article. Review.
-
The key role of growth hormone-insulin-IGF-1 signaling in aging and cancer.Crit Rev Oncol Hematol. 2013 Sep;87(3):201-23. doi: 10.1016/j.critrevonc.2013.01.005. Epub 2013 Feb 21. Crit Rev Oncol Hematol. 2013. PMID: 23434537 Free PMC article. Review.
-
Impact of Metformin Use on Survival in Patients with Gastric Cancer and Diabetes Mellitus Following Gastrectomy.Cancers (Basel). 2020 Jul 23;12(8):2013. doi: 10.3390/cancers12082013. Cancers (Basel). 2020. PMID: 32717852 Free PMC article.
References
-
- Chiang GG, Abraham RT. Targeting the mTOR signaling network in cancer. Trends Mol Med. 2007;13:433–42. - PubMed
-
- Belinsky SA, Devereux TR, Maronpot RR, Stoner GD, Anderson MW. Relationship between the formation of promutagenic adducts and the activation of the K-ras protooncogene in lung tumors from A/J mice treated with nitrosamines. Cancer Res. 1989;49:5305–11. - PubMed
-
- Granville CA, Warfel N, Tsurutani J, et al. Identification of a Highly Effective Rapamycin Schedule that Markedly Reduces the Size, Multiplicity, and Phenotypic Progression of Tobacco Carcinogen-Induced Murine Lung Tumors. Clin Cancer Res. 2007;13:2281–9. - PubMed
MeSH terms
Substances
Grants and funding
LinkOut - more resources
Full Text Sources
Other Literature Sources
Medical
Miscellaneous
