Comparative Study
. 2010 Nov;84(22):11729-36.
doi: 10.1128/JVI.01423-10. Epub 2010 Sep 1.

Conserved and variable features of Gag structure and arrangement in immature retrovirus particles

Affiliations
Comparative Study

Conserved and variable features of Gag structure and arrangement in immature retrovirus particles

Alex de Marco et al. J Virol. 2010 Nov.

Abstract

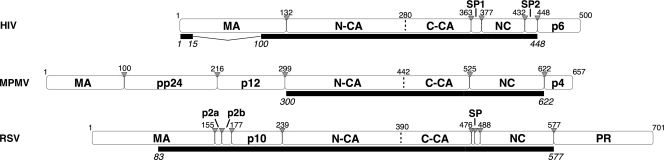
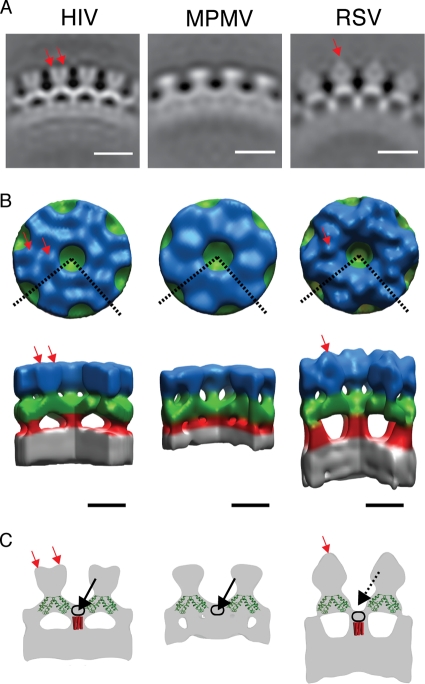
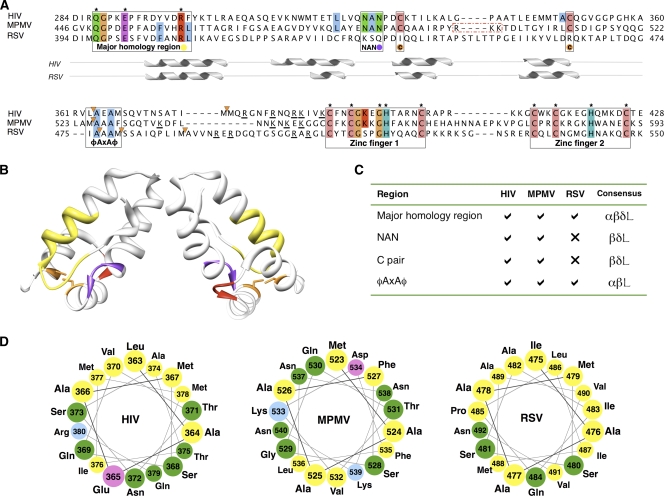
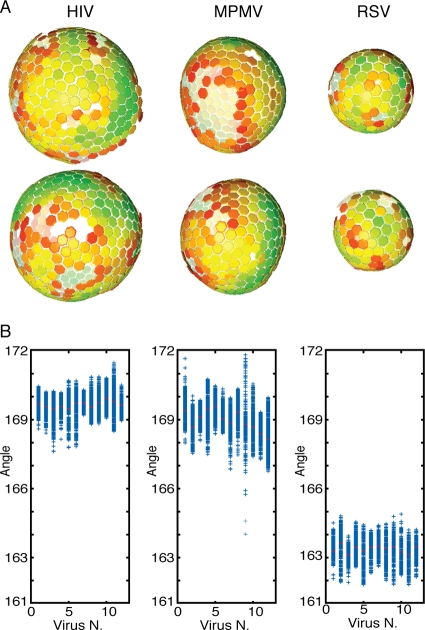
The assembly of retroviruses is driven by oligomerization of the Gag polyprotein. We have used cryo-electron tomography together with subtomogram averaging to describe the three-dimensional structure of in vitro-assembled Gag particles from human immunodeficiency virus, Mason-Pfizer monkey virus, and Rous sarcoma virus. These represent three different retroviral genera: the lentiviruses, betaretroviruses and alpharetroviruses. Comparison of the three structures reveals the features of the supramolecular organization of Gag that are conserved between genera and therefore reflect general principles of Gag-Gag interactions and the features that are specific to certain genera. All three Gag proteins assemble to form approximately spherical hexameric lattices with irregular defects. In all three genera, the N-terminal domain of CA is arranged in hexameric rings around large holes. Where the rings meet, 2-fold densities, assigned to the C-terminal domain of CA, extend between adjacent rings, and link together at the 6-fold symmetry axis with a density, which extends toward the center of the particle into the nucleic acid layer. Although this general arrangement is conserved, differences can be seen throughout the CA and spacer peptide regions. These differences can be related to sequence differences among the genera. We conclude that the arrangement of the structural domains of CA is well conserved across genera, whereas the relationship between CA, the spacer peptide region, and the nucleic acid is more specific to each genus.


Figures

FIG. 1.
FIG. 1.
Modular architecture of the full-length Gag proteins of HIV, M-PMV, and RSV. White rectangles illustrate Gag polyprotein cleavage products. The extent of the constructs used in the electron microscopic analysis is specified under each protein as a black rectangle. Gray triangles specify cleavage sites. Residue numbers are counted from the beginning of Gag.
FIG. 2.
FIG. 2.
Structure of the in vitro-assembled Gag particles. (A) Radial section through the average structures. The density is white. The scale bar is 10 nm. (B) Surface rendering of the average structures. The color scheme follows an approximate radial division of the structure according to the different domains of Gag as previously assigned (6, 44, 45, 46): gray is the NC-nucleic acid layer, red is the SP1 region, green is the C-CA region, and blue is the N-CA. The dashed lines on the top view represent the section cut out in the side view. Red arrows indicate densities protruding from the N-CA density (see the text). Scale bar, 5 nm. (C) Sections through the isosurface representations (gray), illustrating features referred to in the text. The crystal structure of the CA dimer (PDB: 3ds2) (green) is superimposed on the sections indicated previously (6). Red rods indicate possible positions of a hypothetical 24-Å six-helix bundle. Red arrows indicate densities protruding from the N-CA density. Black arrows indicate density forming the floor of the hole in the C-CA ring. Black rings indicate possible positions of the residues between the final helix in the C-CA and the six-helix bundle. For explanations, see the text.
FIG. 3.
FIG. 3.
Comparisons of the Gag sequences from HIV, M-PMV, and RSV. (A) Multiple alignment of Gag C-CA-NC for RSV, M-PMV, and HIV. Regions of interest are boxed, and colored circles indicate the coloring of these regions in panels B and C. Residues conserved across >75% of viruses in an extended alignment, including 12 viral species (see Fig. S3 in the supplemental material), are colored using ClustalX coloring; residues conserved across all species are specified by an asterisk. Orange triangles denote cleavage sites. Basic residues adjacent to the NC are underlined. A dashed red box surrounds an RKK motif unique to M-PMV C-CA. The position of helices from the solved structures for RSV (PDB: 1d1d) and HIV (PDB: 3ds2) are shown under the alignment for illustrative purposes. Residues are numbered from the beginning of Gag. (B) HIV C-CA (PDB: 3ds2) with residues colored to indicate the positions of regions of interest: yellow, MHR; purple, NAN; orange, paired cysteine residues; and red, RKK motif (see the text and panels A and C). (C) Table of regions of interest defined in panel A; the colors correspond to the coloring in the multiple alignment (A) and HIV structure (A). Consensus signifies genera in which the feature is found (α signifies alpha, β signifies beta, δ signifies delta, and L signifies lentiretroviruses). There is currently no solved structure for the CA region in M-PMV, the final helix of M-PMV is defined assuming structural homology to HIV (PDB: 3ds2). (D) Helical wheel representation of the 18 residues after the CA adjacent cleavage site for the proteins of interest.
FIG. 4.
FIG. 4.
Global arrangement of Gag lattice in the particles. (A) Global lattice maps of in vitro-assembled Gag particles. The centers of each hexameric unit cell are marked with hexamers, which are colored according to cross correlation on a scale from low (red) to high (green). Higher cross-correlation values indicate that the subtomogram is more similar to the average structure. The cross-correlation range in the each map has been set between the minimum and the maximum cross-correlation value present in the map. Maps are shown in perspective, such that hexamers on the rear surface of the particle appear smaller and fainter. Two representative particles are shown for each genus. (B) Scatter plot showing the distribution of the angles between each hexamer and its neighbors (see Materials and Methods). The mean value for each particle is marked in red. For each construct, 12 particles have been analyzed.

References

    1. Accola, M. A., S. Hoglund, and H. G. Gottlinger. 1998. A putative alpha-helical structure which overlaps the capsid-p2 boundary in the human immunodeficiency virus type 1 Gag precursor is crucial for viral particle assembly. J. Virol. 72:2072-2078. - PMC - PubMed
    1. Adamson, C. S., and E. O. Freed. 2007. Human immunodeficiency virus type 1 assembly, release, and maturation. Adv. Pharmacol. 55:347-387. - PubMed
    1. Ako-Adjei, D., M. C. Johnson, and V. M. Vogt. 2005. The retroviral capsid domain dictates virion size, morphology, and coassembly of gag into virus-like particles. J. Virol. 79:13463-13472. - PMC - PubMed
    1. Borsetti, A., A. Ohagen, and H. G. Gottlinger. 1998. The C-terminal half of the human immunodeficiency virus type 1 Gag precursor is sufficient for efficient particle assembly. J. Virol. 72:9313-9317. - PMC - PubMed
    1. Briggs, J. A., M. C. Johnson, M. N. Simon, S. D. Fuller, and V. M. Vogt. 2006. Cryo-electron microscopy reveals conserved and divergent features of gag packing in immature particles of Rous sarcoma virus and human immunodeficiency virus. J. Mol. Biol. 355:157-168. - PubMed

Publication types

MeSH terms

Substances

LinkOut - more resources