Comparative Study
. 2010 Sep 1;30(35):11826-37.
doi: 10.1523/JNEUROSCI.2012-10.2010.

Associative plasticity at excitatory synapses facilitates recruitment of fast-spiking interneurons in the dentate gyrus

Affiliations
Comparative Study

Associative plasticity at excitatory synapses facilitates recruitment of fast-spiking interneurons in the dentate gyrus

Sivakumar Sambandan et al. J Neurosci. .

Abstract

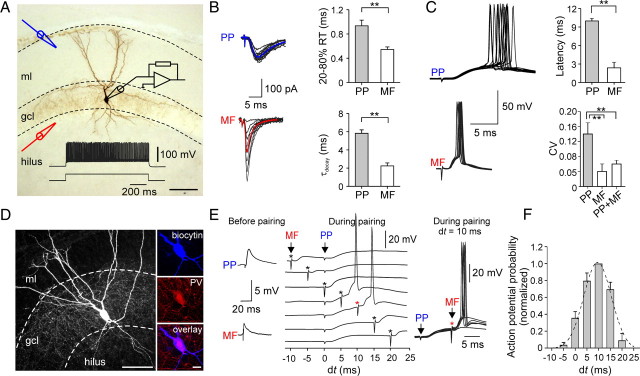
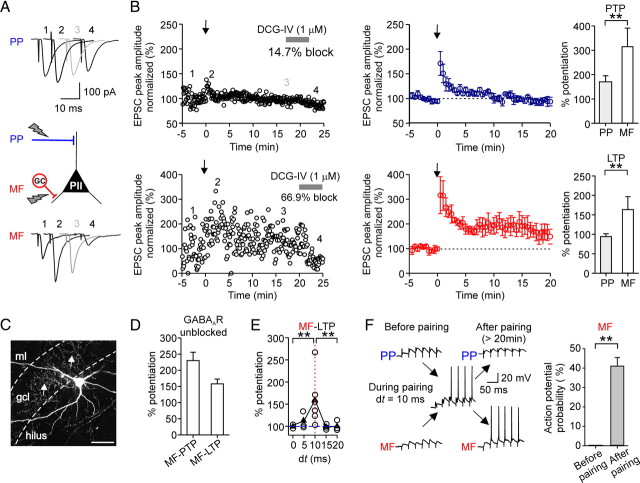
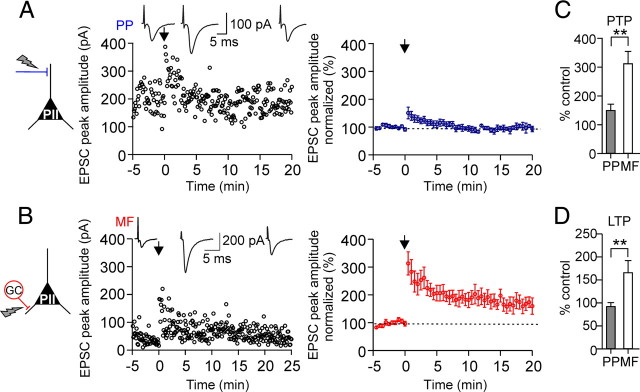
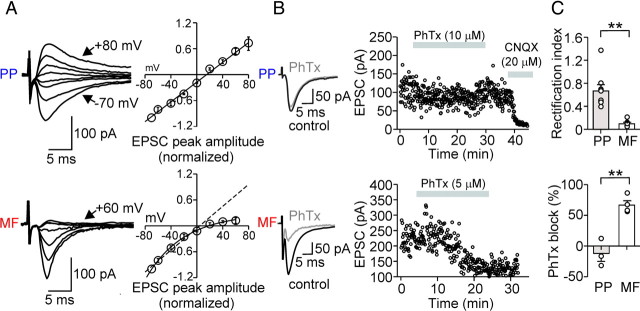
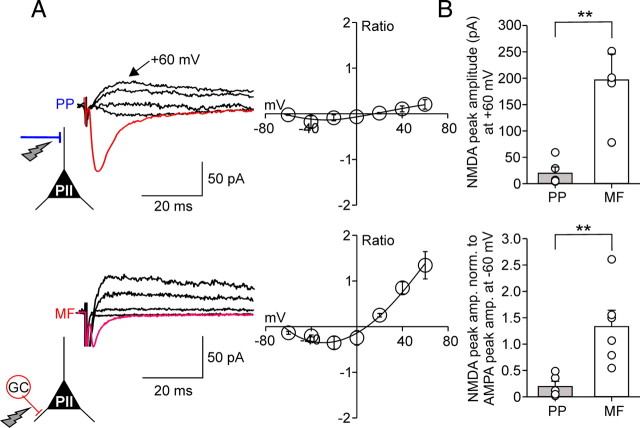
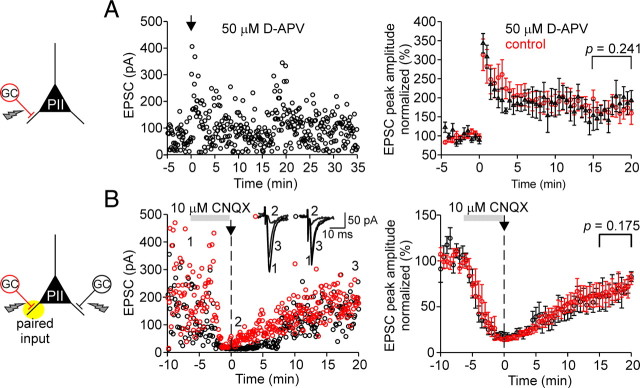
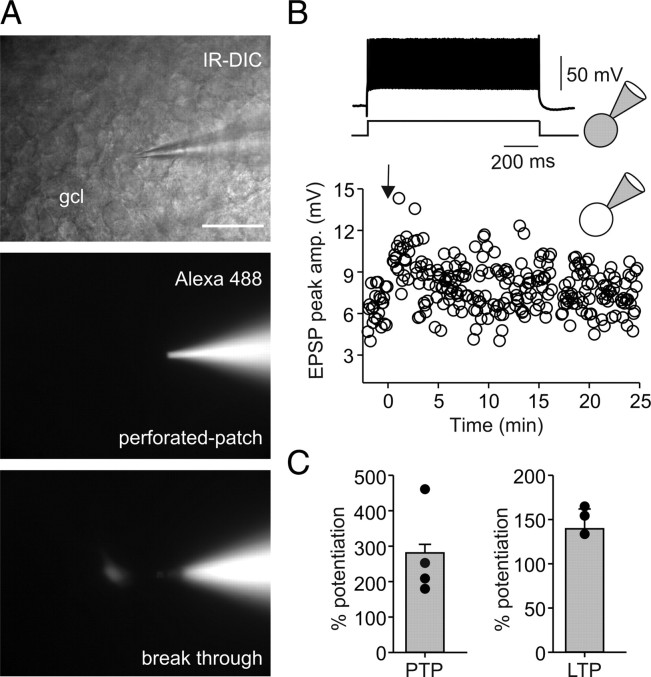
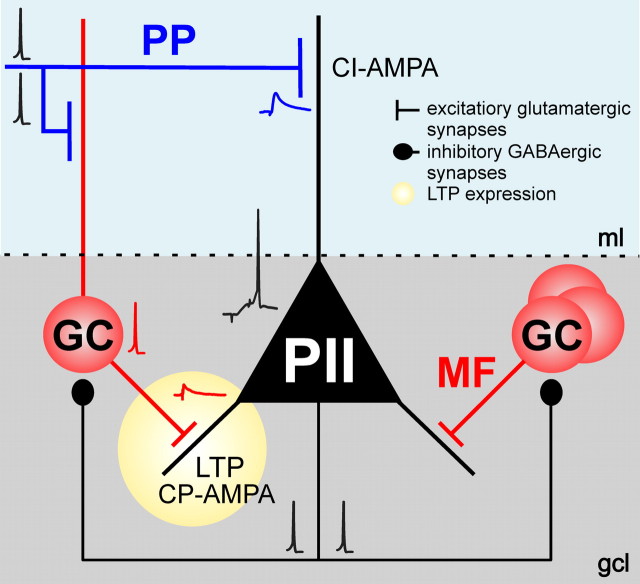
Fast-spiking perisomatic-inhibitory interneurons (PIIs) receive convergent excitation and mediate both feedforward and feedback inhibition in cortical microcircuits. However, it remains poorly understood how convergent excitatory inputs recruit PIIs to produce precisely timed inhibition. Here, we analyzed the interaction of inputs from the entorhinal cortex [perforant path (PP)] and from local granule cells [mossy fibers (MFs)] onto PIIs in the rat dentate gyrus (DG). PP stimulation alone activates PIIs with low temporal precision. Interestingly, when PP and MFs are coactivated with a 10 ms delay, PIIs discharge with precise timing. Moreover, repeated coactivation of the two inputs induces associative long-term potentiation (LTP) at MF synapses. Under these conditions, a single potentiated MF input is sufficient to recruit PIIs in a reliable and highly precise manner to provide feedback inhibition. MF-LTP depends on the discharge of PIIs, indicating Hebbian plasticity. However, MF-LTP is preserved when NMDA receptors are blocked but depends on transmission through Ca(2+)-permeable AMPA receptors (AMPARs). PP-PII synapses, in contrast, lack Ca(2+)-permeable AMPARs and do not show plasticity on associative activation. Thus, precise recruitment of PIIs requires excitation through MF-PII synapses during feedforward activation. We propose that associative plasticity at these synapses is a central mechanism that adjusts inhibition levels to maintain sparse activity and to improve signal-to-noise ratio in the DG network.


Figures

Figure 1.
Figure 1.
Convergence of slow perforant path- and fast mossy fiber-mediated excitation leads to reliable and precise activation of DG perisomatic inhibitory interneurons. A, Illustration of the EPSC recording configuration. Black electrode, Somatic whole-cell recording from a PII; blue electrode, placed in the outer ml for extracellular stimulation of PP fibers; red electrode, positioned at the gcl–hilus border to stimulate MFs. Cell was filled with biocytin during the recording and visualized with DAB as chromogen. Dense axonal arbor in the gcl identify this cell as PII. Inset, Fast-spiking phenotype of the same PII (600 pA). The dashed lines indicate the borders of the gcl and the ml. B, Superimposed individual EPSCs (black) in response to PP (top) or MF (bottom) stimulation, recorded in the same PII. Note fluctuation in the peak amplitude of MF-mediated EPSCs. Stimulation intensity was set to 1.5 times the minimal stimulation. The blue and red traces are averaged EPSCs. Right, Bar charts provide comparison of 20–80% RT and decay time constant (τdecay) of average EPSCs. C, Left, Superimposed action potentials during PP (top) or MF (bottom) stimulation recorded in current-clamp mode. Right, Comparison of mean values and the CV of evoked action potential latencies. D, Left, Projection of a confocal image stack of another recorded PII. The biocytin-filled interneuron was visualized using streptavidin-conjugated Alexa 647 dye. Right, High-power confocal images show immunoreactivity for parvalbumin (PV) in the soma of the same cell. E, Pairing of PP- and MF-EPSPs with varying relative latencies (dt = tMFtPP). PP stimulation was applied at t = 0 ms and timing of the MF stimulation (asterisk) was changed in 5 ms steps between −10 and +20 ms. The left panel shows the subthreshold PP- and MF-EPSPs. On the right, superposed responses illustrate the efficient initiation of action potentials by the paired stimuli with a 10 ms relative delay. F, Bar chart summary of action potential probability as a function of the delay dt between PP and MF stimulation (5 cells). Data were normalized to values obtained at dt = 10 ms and fitted with a Gaussian function (dashed line). Scale bars: A, D, left, 100 μm; D, right, 20 μm. **p < 0.01, two-tailed Student's t test. The bars represent means ± SEM.
Figure 2.
Figure 2.
Associative pairing of perforant path and mossy fiber inputs in perisomatic inhibitory interneurons induces Hebbian LTP selectively at mossy fiber synapses. A, To test plasticity, an aBFS pattern was applied, in which PP stimulation preceded MF stimulation by 10 ms (spike probability during pairing in this experiment 71%, corresponding to a mean discharge frequency of 24 Hz). The panel shows average EPSCs in response to PP (top traces) or MF (bottom traces) stimulation before the aBFS (1), immediately after the aBFS, during PTP (2), 15–20 min after the aBFS induction (gray) (3), and after application of 1 μm DCG-IV (4). B, Left, Normalized EPSC peak amplitudes are plotted against time from a single experiment. PP- (top plot) and MF-mediated EPSCs (bottom plot) were recorded in an alternating manner in the PII (800 ms apart). EPSCs were normalized to the baseline. The arrows indicate the time of the pairing protocol. Middle, Summary plots of the experiments from five cells. Each circle represents the average of EPSCs over 30 s intervals for five cells; PP-EPSC amplitudes are in blue, and MF-EPSCs are in red. Right, Bar graphs compare the extent of PTP and LTP at the two pathways. C, Morphology of the PII from which data are shown in A and B. The arrows point to axon collaterals in the gcl. The dashed lines indicate borders of the gcl toward the ml and the hilus. D, Summary bar graph illustrates the level of PTP and LTP at MF–PII synapses induced by associative pairing in the presence of GABAergic transmission (3 cells). E, Summary plot shows the potentiation of the EPSC peak amplitude, measured 15–20 min after aBFS application, as a function of the relative latency between the PP and MF stimulation (dt). The open circles represent data from individual experiments, and the filled triangles represent the mean values for every dt. F, MF-EPSPs but not PP-EPSPs can recruit PIIs after LTP induction. Brief trains (30 Hz) of EPSPs evoked by PP (top traces) or MF (bottom traces) stimulation before pairing (left) and >20 min after LTP induction (right). Responses to the first 6 of 25 consecutive pulses are shown. Right, Summary bar graph of the probability of action potential generation in response to burst stimulation of MF synapses before and after the pairing from five cells. Scale bar, 100 μm. **p < 0.01, two-tailed Student's t test and Mann–Whitney U test. Average measurements are given as mean ± SEM.
Figure 3.
Figure 3.
Afferent-specific expression of LTP in perisomatic inhibitory interneurons. A, A nonassociative BFS applied to PP–PII synapses in combination with brief suprathreshold depolarizations in the postsynaptic cell (see Materials and Methods) induces PTP but not LTP. Left, Individual EPSC peak amplitudes from a single experiment are plotted against time before and after pairing. The nonassociative BFS was applied at t = 0 ms (arrow). Insets on top, Average EPSCs (30 traces) during the baseline period (left), during PTP (middle), and 15–20 min after the induction protocol (right). Right, Summary time course of EPSC peak amplitudes evoked at PP–PII synapses (blue) before and after pairing from eight cells. EPSCs were averaged over 30 s intervals and normalized to baseline values. B, Corresponding data for MF–PII synapses. At the MF input, pairing resulted in a PTP followed by a marked LTP (10 cells). C, D, Summary bar graphs comparing the effect of the applied nonassociative BFS on the peak amplitude of average EPSCs during the PTP (C) and the LTP phase (D) evoked by extracellular stimulation of the PP or the MF inputs. **p < 0.01; two-tailed Student's t test and Mann–Whitney U test. Average measurements are represented as mean ± SEM.
Figure 4.
Figure 4.
Afferent-specific expression of Ca2+-impermeable and Ca2+-permeable AMPA receptors in perisomatic inhibitory interneurons. A, Left, Average EPSCs from 30 single traces evoked at PP–PII (top) and MF–PII (bottom) inputs for various holding potentials (10 or 20 mV increments). Right, Current–voltage (I–V) relationship for PP- (top; 9 cells) and MF-mediated (bottom; 6 cells) EPSCs in PIIs. Peak amplitudes of the average EPSCs were plotted against the holding potential. The black curves represent the linear (top) or polynomial function (bottom) fitted to the data. The inwardly rectifying I–V relationship at MF–PII synapses is a hallmark of CP-AMPARs (Geiger et al., 1995; Tóth and McBain, 1998). B, MF-mediated EPSCs are blocked by 5–10 μm PhTx-433, a selective CP-AMPAR blocker (Tóth and McBain, 1998). Left, Superposed average EPSCs evoked at PP–PII (top) and MF–PII (bottom) synapses under control conditions (black traces) and during bath application of PhTx-433 (gray traces). Right, Time course of the PhTx-433 effect; peak amplitude of EPSCs evoked at the PP (top) and the MF inputs (bottom) are plotted against time. The gray bars represent the wash-in of PhTx-433 and, at a later phase, CNQX. C, Top bar graph, Summary of the rectification index (EPSC at +60 mV/EPSC at −60 mV) for EPSCs evoked at PP–PII (9 cells) and MF–PII synapses (6 cells). Bottom bar graph, Comparison of the average block of PhTx-433 on PP- (3 cells) and MF-mediated EPSCs (4 cells). **p < 0.005; Mann–Whitney U test. Average measurements represent mean ± SEM.
Figure 5.
Figure 5.
The ratio between NMDA receptor- and AMPA receptor-mediated components is larger at mossy fiber than at perforant path input synapses onto perisomatic inhibitory interneurons. A, Left in red, AMPAR-mediated average EPSCs (30 single traces) at a Vhold of −60 mV at PP–PII (top) and MF–PII (bottom) synapses (in the absence of NMDAR blocker). Superimposed in black, Average NMDAR-mediated EPSCs evoked at four selected holding potentials (−20, +20, +40, and +60 mV) after bath application of the AMPAR blocker CNQX (20 μm). Right, I–V relationship for the PP–PII (top; 5 cells) and the MF–PII synapse-mediated (bottom; 6 cells) NMDA component normalized to the AMPAR-mediated component at −60 mV. The black curves represent third-order polynomial functions fitted to the data. B, The top bar graph summarizes the peak amplitude data for NMDAR-mediated EPSCs recorded at +60 mV evoked at PP–PII and MF–PII synapses. The bottom bar graph compares the NMDAR-mediated component at +60 mV normalized to EPSCs evoked by AMPAR activation at −60 mV for the two pathways. **p < 0.01, two-tailed Student's t test. Average measurements represent mean ± SEM.
Figure 6.
Figure 6.
LTP at mossy fiber–perisomatic inhibitory interneuron synapses is NMDA receptor independent but requires AMPA receptor activation. A, Left, Individual peak amplitudes of AMPAR-mediated EPSCs elicited at MF–PII synapses in the presence of the NMDAR blocker d-APV plotted as a function of time before and after pairing for a single PII. The arrow indicates the time of BFS application. Right, LTP in the presence of d-APV (50 μm; black circles) is expressed to the same extent (175.8 ± 27.8% at 15–20 min after pairing; 5 cells) as in the absence of d-APV (red circles; 166.4 ± 25.7%; p = 0.241; same data as in Fig. 3B), demonstrating that LTP at MF–PII synapses is not NMDAR dependent. B, Block of AMPARs at MF–PII synapses prevents LTP. Left, Amplitudes of individual EPSCs are plotted as a function of time for two independent MF inputs to a single PII. After a baseline period, 10 μm CNQX was washed in to block AMPARs (Vhold = −70 mV; amplitude reduction, ∼85%). A BFS was applied to one MF input (red circles) at t = 0 (arrow). Washout of CNQX was started immediately after the pairing protocol. Time course of recovery of the paired MF input (red circles) and the unpaired MF input (black circles) was similar indicating that LTP was not induced. Inset, Average EPSCs during the control period (1), first 30 s after the pairing (2), and at late phases after LTP induction (15–20 min). Right, Summary of the experimental data from eight cells. Each circle represents the average of EPSCs over 30 s intervals for the paired (black) and control MF input (red) normalized to the mean baseline amplitudes. The gray bars indicate the duration of the CNQX wash-in; the vertical dashed lines refer to the time of the BFS. A, Two-tailed Student's t test. B, Wilcoxon's signed rank test. Average measurements represent mean ± SEM.
Figure 7.
Figure 7.
Gramicidin perforated-patch recordings reveal that Hebbian associative LTP persist at mossy fiber–perisomatic inhibitory interneuron synapses with intact internal milieu. A, Top, IR-DIC image of a perforated-patch recording from a fast-spiking (B, inset) PII with soma in the gcl. Middle, Epifluorescence image of the same neuron during recording to monitor stability of the perforated patch. Alexa Fluor 488 (50 μm) was added to the pipette solution. Note that the fluorescence signal is restricted to the pipette indicating integrity of the perforated-patch. Bottom image, Spontaneous breakthrough is indicated by labeling of the cell body. B, A BFS protocol applied to MF input in association with depolarization in the postsynaptic PII (see Materials and Methods) at t = 0 ms (arrow) evokes stable LTP in the perforated-patch configuration. EPSP peak amplitude is plotted against time before and after the BFS. Inset on top, At the end of the LTP recording, the same cell was repatched to show its fast-spiking, nonadapting action potential phenotype (adaptation ratio, 0.81) during long-lasting depolarizing current injections (600 pA; 1 s). C, Comparison of PTP and LTP in four perforated-patch recorded PIIs. The bars represent mean ± SEM. The circles represent single data points.
Figure 8.
Figure 8.
Schematic illustration of the mechanisms underlying pathway-specific LTP at an excitatory synapse onto perisomatic inhibitory interneurons. Repeated coactivation of PP and MF inputs converging onto a postsynaptic PII with a disynaptic latency of ∼10 ms induces LTP at MF synapses. LTP requires CP-AMPARs that are selectively expressed at MF–PII terminals. In contrast, PP–PII synapses express predominantly CI-AMPARs and do not show LTP in our experiments. Synaptic plasticity at MF–PII synapses leads to enhanced recruitment of PIIs and, thereby, an increased feedback inhibition in the DG circuitry, an important requirement for maintaining sparse activity in the principal cell population and a high signal-to-noise ratio in information processing. See text for additional details. The traces represent average EPSPs and single action potentials.

Similar articles

Cited by

References

    1. Acsády L, Kamondi A, Sík A, Freund T, Buzsáki G. GABAergic cells are the major postsynaptic targets of mossy fibers in the rat hippocampus. J Neurosci. 1998;18:3386–3403. - PMC - PubMed
    1. Alle H, Jonas P, Geiger JR. PTP and LTP at a hippocampal mossy fiber-interneuron synapse. Proc Natl Acad Sci U S A. 2001;98:14708–14713. - PMC - PubMed
    1. Anderson P, Bliss TV, Skrede KK. Lamellar organization of hippocampal excitatory pathways. Exp Brain Res. 1971;13:222–234. - PubMed
    1. Angulo MC, Rossier J, Audinat E. Postsynaptic glutamate receptors and integrative properties of fast-spiking interneurons in the rat neocortex. J Neurophysiol. 1999;82:1295–12302. - PubMed
    1. Aponte Y, Bischofberger J, Jonas P. Efficient Ca2+ buffering in fast-spiking basket cells of rat hippocampus. J Physiol. 2008;586:2061–2075. - PMC - PubMed

Publication types

LinkOut - more resources