

Shank2 redistributes with NaPilla during regulated endocytosis
- PMID: 20810910
- PMCID: PMC3006337
- DOI: 10.1152/ajpcell.00183.2010
Shank2 redistributes with NaPilla during regulated endocytosis
Abstract
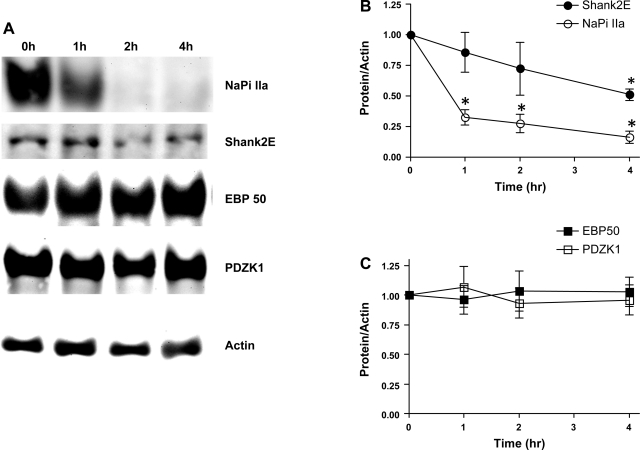
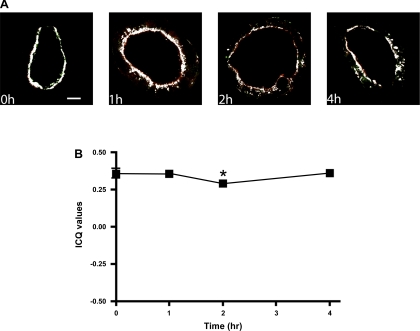
Serum phosphate levels are acutely impacted by the abundance of sodium-phosphate cotransporter IIa (NaPiIIa) in the apical membrane of renal proximal tubule cells. PSD-95/Disks Large/Zonula Occludens (PDZ) domain-containing proteins bind NaPiIIa and likely contribute to the delivery, retention, recovery, and trafficking of NaPiIIa. Shank2 is a distinctive PDZ domain protein that binds NaPiIIa. Its role in regulating NaPiIIa activity, distribution, and abundance is unknown. In the present in vivo study, rats were maintained on a low-phosphate diet, and then plasma phosphate levels were acutely elevated by high-phosphate feeding to induce the recovery, endocytosis, and degradation of NaPiIIa. Western blot analysis of renal cortical tissue from rats given high-phosphate feed showed NaPiIIa and Shank2 underwent degradation. Quantitative immunofluorescence analyses, including microvillar versus intracellular intensity ratios and intensity correlation quotients, showed that Shank2 redistributed with NaPiIIa during the time course of NaPiIIa endocytosis. Furthermore, NaPiIIa and Shank2 trafficked through distinct endosomal compartments (clathrin, early endosomes, lysosomes) with the same temporal pattern. These in vivo findings indicate that Shank2 is positioned to coordinate the regulated endocytic retrieval and downregulation of NaPiIIa in rat renal proximal tubule cells.
Figures


Similar articles
-
Shank2 contributes to the apical retention and intracellular redistribution of NaPiIIa in OK cells.Am J Physiol Cell Physiol. 2013 Mar;304(6):C561-73. doi: 10.1152/ajpcell.00189.2012. Epub 2013 Jan 16. Am J Physiol Cell Physiol. 2013. PMID: 23325414 Free PMC article.
-
Shank2E binds NaP(i) cotransporter at the apical membrane of proximal tubule cells.Am J Physiol Cell Physiol. 2005 Oct;289(4):C1042-51. doi: 10.1152/ajpcell.00568.2004. Epub 2005 May 25. Am J Physiol Cell Physiol. 2005. PMID: 15917299
-
Fibroblast growth factor 23 leads to endolysosomal routing of the renal phosphate cotransporters NaPi-IIa and NaPi-IIc in vivo.Am J Physiol Renal Physiol. 2021 Dec 1;321(6):F785-F798. doi: 10.1152/ajprenal.00250.2021. Epub 2021 Nov 1. Am J Physiol Renal Physiol. 2021. PMID: 34719948
-
Novel aspects in regulated expression of the renal type IIa Na/Pi-cotransporter.Kidney Int Suppl. 2004 Oct;(91):S5-S12. doi: 10.1111/j.1523-1755.2004.09102.x. Kidney Int Suppl. 2004. PMID: 15461703 Review.
-
PDZ interactions and proximal tubular phosphate reabsorption.Am J Physiol Renal Physiol. 2004 Nov;287(5):F871-5. doi: 10.1152/ajprenal.00244.2004. Am J Physiol Renal Physiol. 2004. PMID: 15475541 Review.
Cited by
-
Human podocytes perform polarized, caveolae-dependent albumin endocytosis.Am J Physiol Renal Physiol. 2014 May 1;306(9):F941-51. doi: 10.1152/ajprenal.00532.2013. Epub 2014 Feb 26. Am J Physiol Renal Physiol. 2014. PMID: 24573386 Free PMC article.
-
Shank2 Regulates Renal Albumin Endocytosis.Physiol Rep. 2015 Sep;3(9):e12510. doi: 10.14814/phy2.12510. Physiol Rep. 2015. PMID: 26333830 Free PMC article.
-
Shank2 contributes to the apical retention and intracellular redistribution of NaPiIIa in OK cells.Am J Physiol Cell Physiol. 2013 Mar;304(6):C561-73. doi: 10.1152/ajpcell.00189.2012. Epub 2013 Jan 16. Am J Physiol Cell Physiol. 2013. PMID: 23325414 Free PMC article.
-
Serum- and glucocorticoid-induced protein kinase 1 (SGK1) increases the cystic fibrosis transmembrane conductance regulator (CFTR) in airway epithelial cells by phosphorylating Shank2E protein.J Biol Chem. 2014 Jun 13;289(24):17142-50. doi: 10.1074/jbc.M114.555599. Epub 2014 May 8. J Biol Chem. 2014. PMID: 24811177 Free PMC article.
-
NHE3 regulatory factor 1 (NHERF1) modulates intestinal sodium-dependent phosphate transporter (NaPi-2b) expression in apical microvilli.J Biol Chem. 2012 Oct 12;287(42):35047-35056. doi: 10.1074/jbc.M112.392415. Epub 2012 Aug 17. J Biol Chem. 2012. PMID: 22904329 Free PMC article.
References
-
- Bergwitz C, Roslin NM, MTIeder Loredo-Osti JC, Bastepe M, Abu-Zahra H, Frappier D, Burkett K, Carpenter TO, Anderson D, Garabedian M, Sermet I, Fujiwara TM, Morgan K, Tenenhouse HS, Juppner H. SLC34A3 mutations in patients with hereditary hypophosphatemic rickets with hypercalciuria predict a key role for the sodium-phosphate cotransporter NaPi-IIc in maintaining phosphate homeostasis. Am J Hum Genet 78: 179–192, 2006 - PMC - PubMed
-
- Capuano P, Bacic D, Stange G, Hernando N, Kaissling B, Pal R, Kocher O, Biber J, Wagner CA, Murer H. Expression and regulation of the renal Na/Pi co-transporter NaPi-IIa in a mouse model deficient for the PDZ protein, PDZK1. Eur J Physiol 449: 392–402, 2005 - PubMed
-
- Cosen-Binker LI, Kapus A. Cortactin: the gray eminence of the cytoskeleton. Physiol 21: 352–361, 2006 - PubMed
-
- Deliot N, Hernando N, Horst-Liu Z, Gisler SM, Capuano P, Wagner CA, Bacic D, O'Brien S, Biber J, Murer H. Parathyroid hormone treatment induces dissociation of type IIa Na-Pi cotransporter-NHERF1 complexes. Am J Physiol Cell Physiol 289: C159–C167, 2005 - PubMed
-
- Doctor RB, Bennett V, Mandel LJ. Degradation of spectrin and ankyrin in the ischemic rat kidney. Am J Physiol Cell Physiol 264: C1003–C1013, 1993 - PubMed
Publication types
MeSH terms
Substances
Grants and funding
LinkOut - more resources
Full Text Sources