. 2010 Sep 21;107(38):16465-70.
doi: 10.1073/pnas.1002425107. Epub 2010 Sep 1.

Correction for hidden confounders in the genetic analysis of gene expression

Affiliations

Correction for hidden confounders in the genetic analysis of gene expression

Jennifer Listgarten et al. Proc Natl Acad Sci U S A. .

Abstract

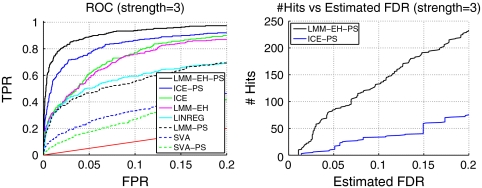
Understanding the genetic underpinnings of disease is important for screening, treatment, drug development, and basic biological insight. One way of getting at such an understanding is to find out which parts of our DNA, such as single-nucleotide polymorphisms, affect particular intermediary processes such as gene expression. Naively, such associations can be identified using a simple statistical test on all paired combinations of genetic variants and gene transcripts. However, a wide variety of confounders lie hidden in the data, leading to both spurious associations and missed associations if not properly addressed. We present a statistical model that jointly corrects for two particular kinds of hidden structure--population structure (e.g., race, family-relatedness), and microarray expression artifacts (e.g., batch effects), when these confounders are unknown. Applying our method to both real and synthetic, human and mouse data, we demonstrate the need for such a joint correction of confounders, and also the disadvantages of other possible approaches based on those in the current literature. In particular, we show that our class of models has maximum power to detect eQTL on synthetic data, and has the best performance on a bronze standard applied to real data. Lastly, our software and the associations we found with it are available at http://www.microsoft.com/science.


Conflict of interest statement

Conflict of interest statement: Eric E. Schadt is Chief Scientific Officer of Pacific Biosciences and owns stock in the company.

Figures

Fig. 1.
Fig. 1.
P-value histograms for human data. Left column shows results on real-data: ICE p-values were deflated as indicated by λ = 0.93, whereas our model, LMM-EH, corrected this to λ = 0.99. The right column shows results on synthetic data: ICE p-values were deflated as indicated by λ = 0.92, whereas our model corrected this to λ = 0.97. Linear regression with SVA covariates was more inflated than linear regression alone.
Fig. 2.
Fig. 2.
Power curves for synthetic human data. The left plot shows the Receiver Operating Characteristic (ROC) curve, which displays the true positive rate (TPR) as a function of the false positive rate (FPR). This plot demonstrates that our model and ICE achieved similar power, surpassing linear regression with or without SVA covariates. The red line denotes what random guessing would have achieved. The right plot shows the number of associations called significant for each estimated FDR level (estimated as in ref. 15), demonstrating that in a real setting, ICE would be penalized for its deflated p-values (λ = 0.93) because they result in overly conservative FDR estimates.
Fig. 3.
Fig. 3.
P-value histograms for mouse data. Left column shows results on real-data: ICE-based p-values were deflated, as indicated by λ ≪ 1. SVA-based models, LMM-PS, LMM-EH, and LINREG were inflated. Only our model (LMM-EH-PS) appeared to be calibrated, with λ = 1.02. Our model also indicated a small number of true associations (roughly 100 of 6,000 tests). The right column shows results on synthetic data: ICE-based p-values were deflated as indicated by λ ≪ 1. Other models were inflated, and our model (LMM-EH-PS) appeared calibrated with λ = 1.00.
Fig. 4.
Fig. 4.
Power curves for synthetic mouse data. The left plot shows the ROC curve, where our model LMM-EH-PS achieved maximum power. The red line denotes what random guessing would have achieved. The right plot illustrates how the best ICE-based model (ICE-PS), which yielded deflated p-values, penalized itself because of its overly conservative estimated FDR.

References

    1. Schadt EE, et al. Genetics of gene expression surveyed in maize, mouse, and man. Nature. 2003;422:297–302. - PubMed
    1. Cookson W, Liang L, Abecasis G, Moffatt M, Lathrop M. Mapping complex disease traits with global gene expression. Nat Rev Genet. 2009;10:184–194. - PMC - PubMed
    1. Cheung VG, Spielman RS. Genetics of human gene expression: mapping DNA variants that influence gene expression. Nat Rev Genet. 2009;10:595–604. - PMC - PubMed
    1. Gilad Y, Rifkin SA, Pritchard JK. Revealing the architecture of gene regulation: the promise of eQTL studies. Trends Genet. 2008;24:408–415. - PMC - PubMed
    1. Nica AC, Dermitzakis ET. Using gene expression to investigate the genetic basis of complex disorders. Hum Mol Genet. 2008;17:R129–R134. - PMC - PubMed

Associated data