

doi: 10.1187/cbe.10-03-0026.
Introductory life science mathematics and quantitative neuroscience courses
Affiliations
- PMID: 20810971
- PMCID: PMC2931686
- DOI: 10.1187/cbe.10-03-0026
Item in Clipboard
Introductory life science mathematics and quantitative neuroscience courses
CBE Life Sci Educ.
2010 Fall.
Abstract
We describe two sets of courses designed to enhance the mathematical, statistical, and computational training of life science undergraduates at Emory College. The first course is an introductory sequence in differential and integral calculus, modeling with differential equations, probability, and inferential statistics. The second is an upper-division course in computational neuroscience. We provide a description of each course, detailed syllabi, examples of content, and a brief discussion of the main issues encountered in developing and offering the courses.
Figures
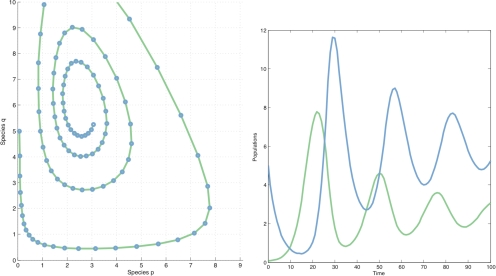
Numerical methods and MATLAB yield the trajectory on the left and the solution curves on the right. There is also Web-based direction field software that will draw trajectories. This allows easy experimentation with different initial conditions and with varied constants in the equations.
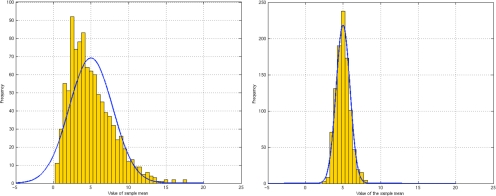
Left, sample size, n = 3. Right, n = 30, with a very close fit to the normal curve predicted by the CLT. Can we approximate the variances for each? Can we account for the difference in variances?
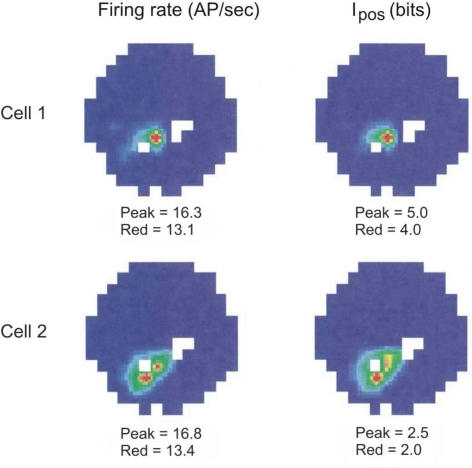
Information versus firing rate. Two hippocampal cells, cell 1 (top row) and cell 2 (bottom row), fired only when the foraging rat visited specific parts (red spots) of the circular arena. Although their peak firing rates were similar (left column), the information measure of spiking, Ipos was not (right column), indicating important distinction between the information processing in these two cells (adapted from Olypher et al., 2003).
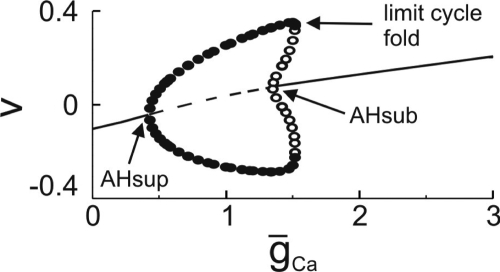
Bifurcation diagram for the Morris-Lecar model. Maximal and minimal values of the membrane potential V for different values ḡCa; ḡK=3. Solid line, stable steady state; dashed line, unstable steady state; filled circles, stable periodic oscillations; and open circles, unstable oscillations. AHsup, supercritical Andronov–Hopf bifurcation; AHsub, subcritical Andronov–Hopf bifurcation. The diagram is obtained by using XPPAUTO (Ermentrout, 2002).
References
-
- Adler F. R. 1st ed. Belmont CA: Thomson-Brooks/Cole; 1989. Modeling the Dynamics of Life: Calculus and Probability for Life Scientists.
-
- Adler F. R. 2nd ed. Belmont CA: Thomson-Brooks/Cole, Belmont CA; 2005. Modeling the Dynamics of Life: Calculus and Probability for Life Scientists.
-
- Allman E., J. Rhodes J. Mathematical Models in Biology. Cambridge, United Kingdom: Cambridge University Press; 2004.
-
- Bittinger M. L., Brand N., Quintanilla J. Calculus for the Life Sciences. Boston, MA: Pearson-Addison Wesley; 2006.
-
- Cullen M. R. Mathematics for the Biosciences. Fairfax, VA: Techbooks; 1983.
Publication types
MeSH terms
Grants and funding
LinkOut - more resources
Full Text Sources
