. 2010 Sep 1;2(47):47ra64.
doi: 10.1126/scitranslmed.3001442.

Overlap and effective size of the human CD8+ T cell receptor repertoire

Affiliations

Overlap and effective size of the human CD8+ T cell receptor repertoire

Harlan S Robins et al. Sci Transl Med. .

Abstract

Diversity in T lymphocyte antigen receptors is generated by somatic rearrangement of T cell receptor (TCR) genes and is concentrated within the third complementarity-determining region 3 (CDR3) of each chain of the TCR heterodimer. We sequenced the CDR3 regions from millions of rearranged TCR beta chain genes in naïve and memory CD8(+) T cells of seven adults. The CDR3 sequence repertoire realized in each individual is strongly biased toward specific V(beta)-J(beta) pair utilization, dominated by sequences containing few inserted nucleotides, and drawn from a defined subset comprising less than 0.1% of the estimated 5 x 10(11) possible sequences. Surprisingly, the overlap in the naïve CD8(+) CDR3 sequence repertoires of any two of the individuals is approximately 7000-fold larger than predicted and appears to be independent of the degree of human leukocyte antigen matching.


Figures
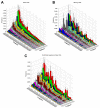
Figure 1
Figure 1
Histograms depicting the mean utilization frequency of specific Vβ–Jβ gene segment combinations in the TCRβ chains expressed in naïve (A) and memory (B) CD8+ T cells of seven healthy adults. All 13 Jβ segments are indicated along one axis, and the 38 of the 54 Vβ segments are indicated along the other axis. Combinations containing gene segments belonging to the Vβ5, Vβ6, and Vβ12 families are not displayed, as the segments in these families have extremely high sequence similarity at their 3′ ends and could not be unambiguously distinguished given the 60-nt sequence reads obtained in this study. (C) Histogram of the mean utilization frequency of specific Vβ–Jβ gene segment combinations in TCRβ CDR3 sequences observed in naïve CD8+ T cells and predicted to generate out-of-frame TCRβ transcripts that would not encode functional TCRβ chain proteins.
Figure 2
Figure 2
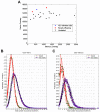
Cumulative distribution of unique TCRβ CDR3 amino acid sequences in naïve (A) and memory (B) CD8+ T cells in the blood of seven healthy adults, as a function of the total number of nucleotide insertions at the Vβ–Dβ and Dβ–Jβ junctions. (C),(D) The TCRβ CDR3 sequences observed in the CD8+ naïve and memory compartments, respectively, of each donor were compared to the complete set of unique sequences generated by a model of TCRβ VDJ rearrangement that allows deletion of up to ten nucleotides adjacent to the RSS of the Vβ, Dβ, and Jβ gene segments, followed by less than or equal to the indicated number of total nucleotide insertions at the two junctions. The fraction of observed sequences in the seven donors that match a sequence generated by the model is shown for naïve cells in (C) and memory cells in (D). (E) The exact number of unique TCRβ CDR3 sequences predicted by the model for 0, 1, 2, …, 7 total insertions, as well as an estimate of the number of sequences predicted by the model for 12 total insertions.
Figure 3
Figure 3
Characteristics of CD8+ TCRβ CDR3 amino acid sequences that were observed in at least two of the seven individuals. (A) Number of shared sequences in the naïve and memory CD8+ CDR3 repertoires of every possible pair of individuals, with the HLA-identical sisters indicated by the blue diamond, each of those sisters paired with their mother indicated by the orange squares, and the remaining pairs, all of which contained two unrelated individuals, indicated by the black triangles. There are 7!/2!5! = 21 different pairs. (B), (C) Frequency distribution of shared (red curves) and non-shared (blue curves) CDR3 sequences observed in the naïve (B) and memory (C) CD8+ compartments of every possible pair of individuals as a function of the total number of nucleotide insertions at the Vβ–Dβ and Dβ–Jβ junctions.
Figure 4
Figure 4
Relative abundance of (A) in-frame, read-through and (B) out-of-frame TCRβ CDR3 sequences as a function of the total number of nucleotide insertions at the Vβ–Dβ and Dβ–Jβ junctions observed in naïve CD8+ T cells from each of the seven donors studied.

Similar articles

Cited by

References

    1. Davis MM, Bjorkman PJ. T-cell antigen receptor genes and T-cell recognition. Nature. 1988 Aug 4;334(6181):395–402. - PubMed
    1. Robins HS, Campregher PV, Srivastava SK, et al. Comprehensive assessment of T-cell receptor beta-chain diversity in alphabeta T cells. Blood. 2009 Nov 5;114(19):4099–4107. - PMC - PubMed
    1. Monod M Yousfi, Giudicelli V, Chaume D, Lefranc MP. IMGT/JunctionAnalysis: the first tool for the analysis of the immunoglobulin and T cell receptor complex V-J and V-D-J JUNCTIONs. Bioinformatics. 2004 Aug 4;20(Suppl 1):i379–385. - PubMed
    1. Malissen M, McCoy C, Blanc D, et al. Direct evidence for chromosomal inversion during T-cell receptor beta-gene rearrangements. Nature. 1986 Jan 2-8;319(6048):28–33. - PubMed
    1. Venturi V, Price DA, Douek DC, Davenport MP. The molecular basis for public T-cell responses? Nat Rev Immunol. 2008 Mar;8(3):231–238. - PubMed

Publication types