

Review
doi: 10.1172/JCI42161.
Epub 2010 Sep 1.
How cortical neurons help us see: visual recognition in the human brain
Affiliations
- PMID: 20811161
- PMCID: PMC2929717
- DOI: 10.1172/JCI42161
Item in Clipboard
Review
How cortical neurons help us see: visual recognition in the human brain
J Clin Invest.
2010 Sep.
Abstract
Through a series of complex transformations, the pixel-like input to the retina is converted into rich visual perceptions that constitute an integral part of visual recognition. Multiple visual problems arise due to damage or developmental abnormalities in the cortex of the brain. Here, we provide an overview of how visual information is processed along the ventral visual cortex in the human brain. We discuss how neurophysiological recordings in macaque monkeys and in humans can help us understand the computations performed by visual cortex.
Figures
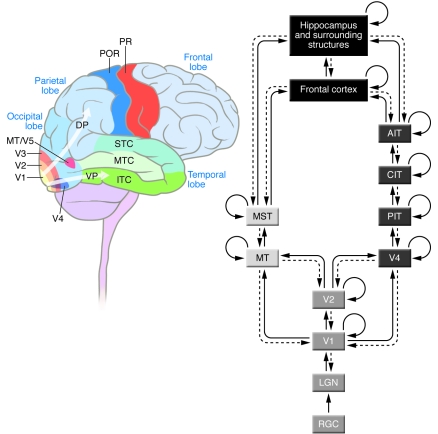
On the left, we show a schematic diagram of the human brain indicating the approximate location of several brain areas discussed in the text. On the right, we provide a schematic description of some of the main pathways involved in processing visual information in cortex. VP, ventral stream; DP, dorsal stream; RGC, retinal ganglion cells; CIT, central ITC; AIT, anterior ITC; MST, medial superior temporal cortex; POR, post-rolandic area; PR, pre-rolandic area. Solid lines indicate forward projections; dashed lines indicate back-projections; and the curved lines represent recurrent connections within a given area. As emphasized in the text, this diagram is a substantial simplification of the actual connectivity in the primate visual system. Many important visual areas and connections are not represented in this diagram; for more details, see ref. .

In spite of large transformations of the original image (top left) in terms of color, noise, scale, blurring, and inversion, recognition remains relatively straightforward. Careful psychophysics studies have quantified and documented the robustness of the human visual system to image transformations. Achieving specificity while maintaining tolerance to object transformations is one of the key challenges for computer vision and constitutes one of the hallmarks of object recognition in primates. Original photo taken by Julie Blumberg.
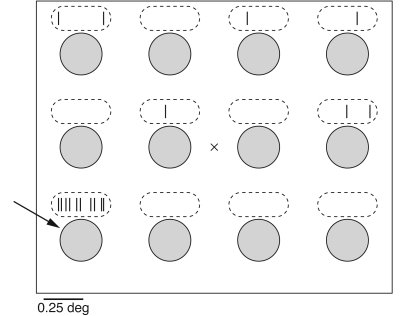
Neurons throughout the visual system respond only to local patches of the visual field. This schematic diagram shows an experimental protocol in which the subject’s eyes are fixated on the center X while investigators show circles at different positions (at each moment in time, there is only one circle on the screen). Above each circle, the ticks indicate the activity of a hypothetical neuron. This neuron fires vigorously when the circle appears in the lower left position, defining its receptive field (arrow). Note that there is spontaneous activity in other locations, but only one location elicits a vigorous response. 0.25 deg, 0.25 degree of visual angle.

Edge detection is thought to mimic one of the initial steps in processing visual information in primary visual cortex (2, 79, 136). Original photo taken by Nambi Nallasamy.
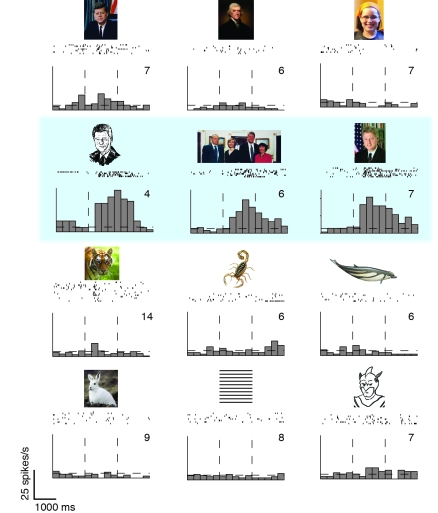
The figure is based on an experiment performed by our research group, in which the images shown to participants were similar to those shown here (see ref. for the actual images and ref. for more examples). The raster plots indicate the action potentials fired by the neuron in response to the image above the raster. Each line represents a separate repetition. Below the raster plots, we show a post-stimulus time histogram (PSTH) aligned to the stimulus onset, showing the average activity of the neuron as a function of time. The activity of this neuron increased in response to three different images of former president Bill Clinton and not to other faces or other stimuli. The neuron showed a remarkable degree of selectivity and tolerance to transformations (92, 137). Image credit (tiger photo):
www.freedigitalphotos.net .
References
-
- Felleman DJ, Van Essen DC. Distributed hierarchical processing in the primate cerebral cortex. Cereb Cortex. 1991;1(1):1–47. - PubMed
-
- Wandell BA.Foundations Of Vision . Sunderland, Massachusetts, USA: Sinauer Associates Inc; 1995.
-
- Serre T, Kreiman G, Kouh M, Cadieu C, Knoblich U, Poggio T. A quantitative theory of immediate visual recognition. Prog Brain Res. 2007;165:33–56. - PubMed
-
- Deco G, Rolls ET.Computational Neuroscience of Vision . New York, New York, USA: Oxford University Press; 2004.
