Review
. 2010 Oct;11(10):673-84.
doi: 10.1038/nrg2830. Epub 2010 Sep 1.

Evaluating genome-scale approaches to eukaryotic DNA replication

Affiliations
Review

Evaluating genome-scale approaches to eukaryotic DNA replication

David M Gilbert. Nat Rev Genet. 2010 Oct.

Abstract

Mechanisms regulating where and when eukaryotic DNA replication initiates remain a mystery. Recently, genome-scale methods have been brought to bear on this problem. The identification of replication origins and their associated proteins in yeasts is a well-integrated investigative tool, but corresponding data sets from multicellular organisms are scarce. By contrast, standardized protocols for evaluating replication timing have generated informative data sets for most eukaryotic systems. Here, I summarize the genome-scale methods that are most frequently used to analyse replication in eukaryotes, the kinds of questions each method can address and the technical hurdles that must be overcome to gain a complete understanding of the nature of eukaryotic replication origins.


Figures

Figure 1
Figure 1. How to find an origin
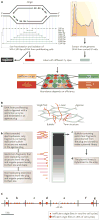
a | Pre-replication complexes consist of at least 14 different proteins conserved in all eukaryotes: cell division cycle protein 6 (Cdc6), DNA replication factor Cdt1, the heterohexameric origin recognition complex (composed of Orc1 to Orc6), and the heterohexameric mini-chromosome maintenance complex (composed of Mcm2 to Mcm7). The ORC competes with nucleosomes to bind to DNA and, once bound, is able to position nucleosomes in such a way as to leave sufficient space for MCM complex loading. b | Summary of the unique nucleic acid features found near origins of replication. When cells that have been synchronized before the onset of S phase initiate replication in the presence of replication fork inhibitors, replication forks are arrested close to sites of initiation so that any DNA synthesized must be close to origins. The sites where forks are arrested consist of primed templates that can be labelled at the sites of arrest by extension. The leading strands of DNA synthesis quickly become larger than Okazaki fragments and can be isolated as small single-stranded molecules that can be verified to be nascent either by metabolic labelling or by virtue of the fact that nascent strands have small stretches of RNA at their 5′ ends that render them resistant to λ exonuclease,. Finally, the physical structure of replication origins shortly after initiation is that of a bubble structure, which can be trapped in gelling agarose (FIG. 2).
Figure 2
Figure 2. Different methods may enrich for different origins
A | Mapping the positions of small nascent leading strands (SNSs). Genomic DNA from proliferating cells is denatured and single-stranded DNA (ssDNA) is size-fractionated, usually by sucrose density gradient centrifugation. Strands that are larger than Okazaki fragments (50–350 bp) but small enough to be representative of initiation sites (usually 500–1,500 bp) are isolated. Genomic DNA is isolated from cells synchronized in G1 phase by sorting cells with an unreplicated DNA content using a fluorescence-activated cell sorter (FACS). G1 DNA is used as a reference for microarray analysis because all sequences have an identical copy number. SNSs and genomic DNA are then differentially labelled and hybridized to a microarray or directly subjected to deep sequencing. In the microarray schematic, the colours represent the efficiencies of the origins. In principle, the degree of enrichment of probe sequences in the SNS preparation should be proportional to the fraction of cells in which initiation takes place close to any given probe, but contamination from broken, unreplicated DNA must be carefully controlled. B | Principle of the bubble-trap method. Ba | Initiation of DNA creates replication bubble structures that essentially behave as circular molecules. Hence, when genomic DNA is digested with a restriction enzyme and then mixed with molten agarose and allowed to cool to form an agarose plug, recently initiated origin-containing fragments become trapped in the polymerized agarose. Bb | The plug is then subjected to exhaustive electrophoresis, which removes all unreplicated fragments as well as replicating fragments containing branched structures resulting from the entry of replication forks initiated outside the DNA fragment. Bc | Origin-containing DNA within the plug is then isolated and cloned. Bd | This cloned DNA can be either hybridized to a microarray or sequenced. C | Types of origins enriched by each method. Vertical lines depict restriction enzyme cutting sites and red circles depict the positions of replication origins, simplified as two types termed efficient or inefficient. The following describes which method would most easily detect the activity of origins positioned as shown. Note that replicate experiments using different restriction enzymes can overcome some of the limitations of the bubble-trap method. Ca | SNSs but not bubble trap. The origin is efficient and localized but the fragment is small and any bubbles formed will be quickly converted to branched or linear structures. Cb | Bubble trap but not SNSs. The individual origins fire too infrequently for their localized sites to be detected by SNSs, but most of them will make bubble structures that will trap the fragment regardless of where initiation occurs. Cc | Bubble trap and SNSs. The right-most origin will be detected by SNSs and the collection of origins will make detectable bubbles. Cd | Bubble trap and SNSs. Because it is an efficient, localized origin, it will be detected by SNS, and because it is positioned at the centre of a sufficiently large restriction fragment, it will generate bubble structures. Ce | Bubble trap, but may be difficult for either method. The origins are too inefficient for SNS detection. For bubble trap, large restriction fragments can be retained false-positives. Large fragments are also more difficult to clone into a plasmid library. Cf | SNSs but not bubble trap. These efficient origins can be detected by SNSs but are too close to the edge of the fragment to be detected by the bubble-trap method. When initiation occurs off-centre, the fragment rapidly converts to a branched structure when the replication fork crosses the restriction site. Cg | Neither method. The origin is too inefficient for detection by SNSs and the fragment is too small for detection by bubble traps. Part B is modified, with permission, from REF. 61 © (2009) Springer.
Figure 3
Figure 3. Replication timing analysis by retroactive fluorescence-activated cell sorter synchronization
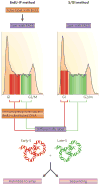
This method can be applied to any proliferating cell population that can be dissociated into a single-cell suspension. Cells are stained with any dye that fluoresces proportionally to DNA content to produce a histogram of the number of cells with unreplicated (G1 phase), fully replicated (G2/M phase) or increasing (S phase) DNA content. In the 5-bromodeoxyuridine immunoprecipitation (BrdU-IP) method, cells are first pulse-labelled with BrdU to tag replicating DNA in a short (10–20%) interval of S phase and then separated into early- and late-S-phase populations by DNA content using the fluorescence-activated cell sorter (FACS). BrdU-substituted nascent DNA from these populations is immunoprecipitated, differentially labelled and co-hybridized to a high-density whole-genome oligonucleotide microarray. Alternatively, the BrdU-IP DNA can be sequenced. In the S/G1 method, unlabelled cells are sorted into either G1 phase populations (in which the copy numbers of all genomic sequences are equivalent) or total S phase populations (in which the copy numbers are proportional to how early the sequence replicates). DNA is isolated and replication timing is determined as the copy number ratio of S/G1 across the genome either on an array or by sequencing. A link to protocols for these methods, and more information, is provided in the ‘Further Information’ section.

References

    1. Masai H, Matsumoto S, You Z, Yoshizawa-Sugata N, Oda M. Eukaryotic chromosome DNA replication: where, when, and how? Annu Rev Biochem. 2010;79:89–130. - PubMed
    1. Woodward AM, et al. Excess Mcm2–7 license dormant origins of replication that can be used under conditions of replicative stress. J Cell Biol. 2006;173:673–683. - PMC - PubMed
    1. Ibarra A, Schwob E, Mendez J. Excess MCM proteins protect human cells from replicative stress by licensing backup origins of replication. Proc Natl Acad Sci USA. 2008;105:8956–8961. - PMC - PubMed
    1. Doksani Y, Bermejo R, Fiorani S, Haber JE, Foiani M. Replicon dynamics, dormant origin firing, and terminal fork integrity after double-strand break formation. Cell. 2009;137:247–258. - PMC - PubMed
    1. Koren A, Soifer I, Barkai N. MRC1-dependent scaling of the budding yeast DNA replication timing program. Genome Res. 2010;20:781–790. - PMC - PubMed

LinkOut - more resources