

Inherited adaptation of genome-rewired cells in response to a challenging environment
- PMID: 20811567
- PMCID: PMC2929631
- DOI: 10.2976/1.3353782
Inherited adaptation of genome-rewired cells in response to a challenging environment
Abstract
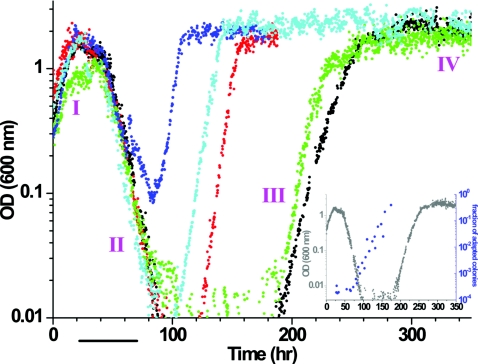
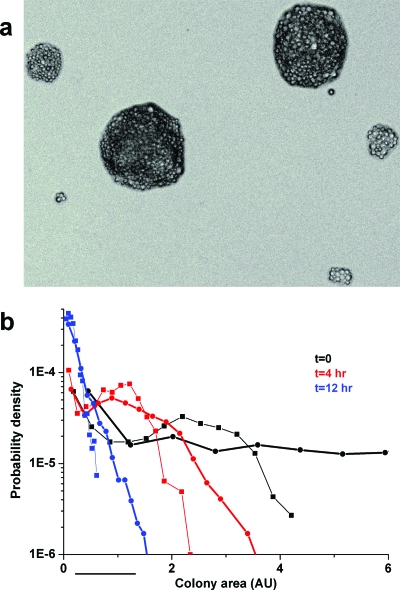
Despite their evolutionary significance, little is known about the adaptation dynamics of genomically rewired cells in evolution. We have confronted yeast cells carrying a rewired regulatory circuit with a severe and unforeseen challenge. The essential HIS3 gene from the histidine biosynthesis pathway was placed under the exclusive regulation of the galactose utilization system. Glucose containing medium strongly represses the GAL genes including HIS3 and these rewired cells are required to operate this essential gene. We show here that although there were no adapted cells prior to the encounter with glucose, a large fraction of cells adapted to grow in this medium and this adaptation was stably inherited. The adaptation relied on individual cells that switched into an adapted state and, thus, the adaptation was due to a response of many individual cells to the change in environment and not due to selection of rare advantageous phenotypes. The adaptation of numerous individual cells by heritable phenotypic switching in response to a challenge extends the common evolutionary framework and attests to the adaptive potential of regulatory circuits.
Figures


Similar articles
-
Cellular plasticity enables adaptation to unforeseen cell-cycle rewiring challenges.PLoS One. 2012;7(9):e45184. doi: 10.1371/journal.pone.0045184. Epub 2012 Sep 18. PLoS One. 2012. PMID: 23028834 Free PMC article.
-
Genome-wide transcriptional plasticity underlies cellular adaptation to novel challenge.Mol Syst Biol. 2007;3:106. doi: 10.1038/msb4100147. Epub 2007 Apr 24. Mol Syst Biol. 2007. PMID: 17453047 Free PMC article.
-
Multiple genomic changes associated with reorganization of gene regulation and adaptation in yeast.Mol Biol Evol. 2013 Jul;30(7):1514-26. doi: 10.1093/molbev/mst071. Epub 2013 Apr 14. Mol Biol Evol. 2013. PMID: 23589456
-
A critical review of adaptive genetic variation in Atlantic salmon: implications for conservation.Biol Rev Camb Philos Soc. 2007 May;82(2):173-211. doi: 10.1111/j.1469-185X.2006.00004.x. Biol Rev Camb Philos Soc. 2007. PMID: 17437557 Review.
-
Molecular and cellular bases of adaptation to a changing environment in microorganisms.Proc Biol Sci. 2016 Oct 26;283(1841):20161458. doi: 10.1098/rspb.2016.1458. Proc Biol Sci. 2016. PMID: 27798299 Free PMC article. Review.
Cited by
-
Computational modeling demonstrates that glioblastoma cells can survive spatial environmental challenges through exploratory adaptation.Nat Commun. 2019 Dec 13;10(1):5704. doi: 10.1038/s41467-019-13726-w. Nat Commun. 2019. PMID: 31836713 Free PMC article.
-
Population dynamics of metastable growth-rate phenotypes.PLoS One. 2013 Dec 2;8(12):e81671. doi: 10.1371/journal.pone.0081671. eCollection 2013. PLoS One. 2013. PMID: 24312571 Free PMC article.
-
Metabolic cost of rapid adaptation of single yeast cells.Proc Natl Acad Sci U S A. 2020 May 19;117(20):10660-10666. doi: 10.1073/pnas.1913767117. Epub 2020 May 5. Proc Natl Acad Sci U S A. 2020. PMID: 32371488 Free PMC article.
-
Collective dynamics of gene expression in cell populations.PLoS One. 2011;6(6):e20530. doi: 10.1371/journal.pone.0020530. Epub 2011 Jun 15. PLoS One. 2011. PMID: 21698278 Free PMC article.
-
Basal Xenobot transcriptomics reveals changes and novel control modality in cells freed from organismal influence.Commun Biol. 2025 Apr 22;8(1):646. doi: 10.1038/s42003-025-08086-9. Commun Biol. 2025. PMID: 40263484 Free PMC article.
References
-
- Allis, C D, Jenuwein, T, and Reinberg, D (eds.) (2007). Epigenetics, Cold Spring Harbor Laboratory Press, Cold Spring Harbor, NY.
-
- Brickner, D G, Cajigas, I, Fondufe-Mittendorf, Y, Ahmed, S, Lee, P-C, Widom, J, and Brickner, J H (2007). “H2A.Z-mediated localization of genes at the nuclear periphery confers epigenetic memory of previous transcriptional state.” PLoS Biol. PBLIBG 5, e81.10.1371/journal.pbio.0050081 - DOI - PMC - PubMed
LinkOut - more resources
Full Text Sources
Molecular Biology Databases