

Mapping drug physico-chemical features to pathway activity reveals molecular networks linked to toxicity outcome
- PMID: 20811577
- PMCID: PMC2929951
- DOI: 10.1371/journal.pone.0012385
Mapping drug physico-chemical features to pathway activity reveals molecular networks linked to toxicity outcome
Abstract
The identification of predictive biomarkers is at the core of modern toxicology. So far, a number of approaches have been proposed. These rely on statistical inference of toxicity response from either compound features (i.e., QSAR), in vitro cell based assays or molecular profiling of target tissues (i.e., expression profiling). Although these approaches have already shown the potential of predictive toxicology, we still do not have a systematic approach to model the interaction between chemical features, molecular networks and toxicity outcome. Here, we describe a computational strategy designed to address this important need. Its application to a model of renal tubular degeneration has revealed a link between physico-chemical features and signalling components controlling cell communication pathways, which in turn are differentially modulated in response to toxic chemicals. Overall, our findings are consistent with the existence of a general toxicity mechanism operating in synergy with more specific single-target based mode of actions (MOAs) and provide a general framework for the development of an integrative approach to predictive toxicology.
Conflict of interest statement
Figures
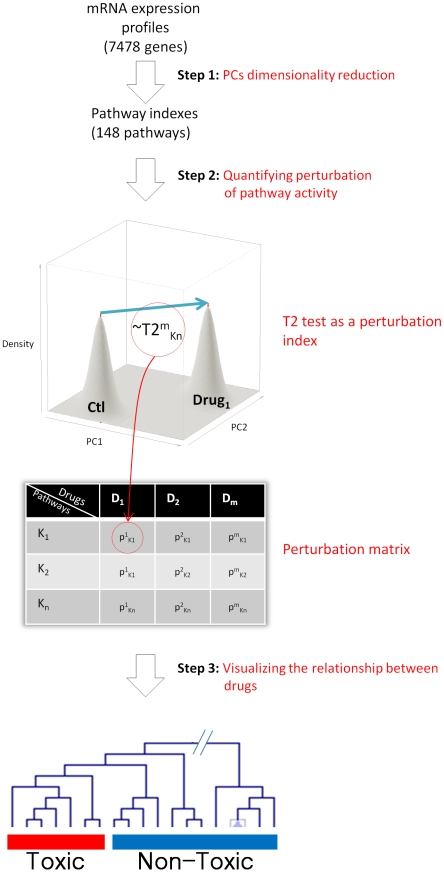
 Hotelling's statistics to compute the perturbation index for a specific drug as compared to a matched control group. The third step is to visualize the relationship between the drugs with the use of a hierarchical clustering. We can then show that the dimensionality reduction in step 1 is biologically relevant to use in the subsequent analysis.
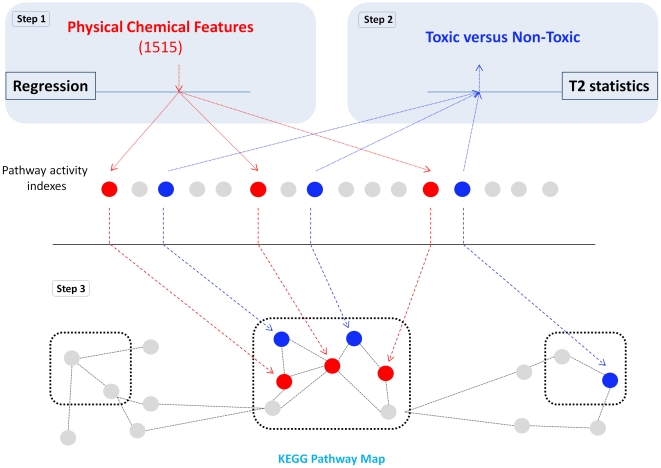
 statistics (Step 2). The resulting pathways were then mapped onto a KEGG pathway map to identify clusters of pathways associated to both PCFs and toxicity (Step 3). Finally we asked the question if the PCFs we have found to be associated to pathways are a better predictor of toxicity.
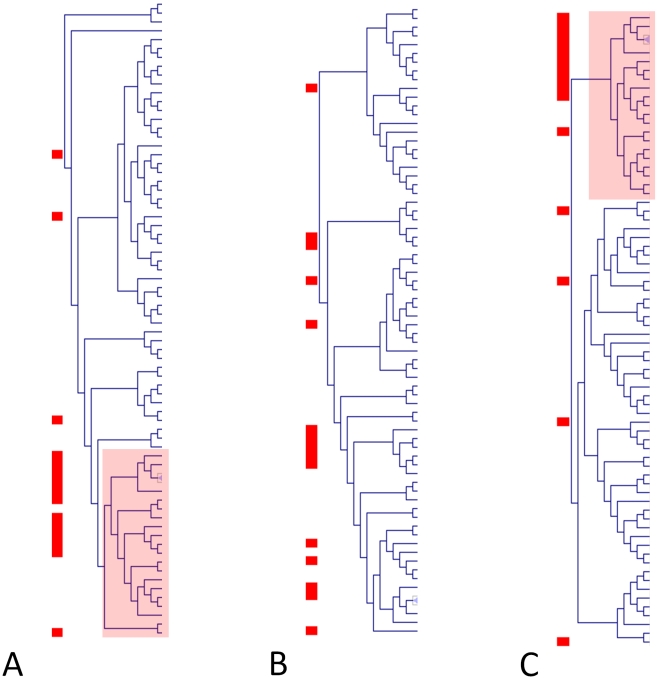
 Hotelling test). Panels B and C represent respectively the results of cluster analysis when the change in pathway activity is estimated by the PC1 or the PC2 (univariate t-test). Notice that toxic chemicals cluster (highlighted areas on Panels A and C) on the basis of the multivariate test and that the information associated to toxicity is primarily represented by the PC2. Toxic chemicals have been highlighted using a red square on the left of each clustering.
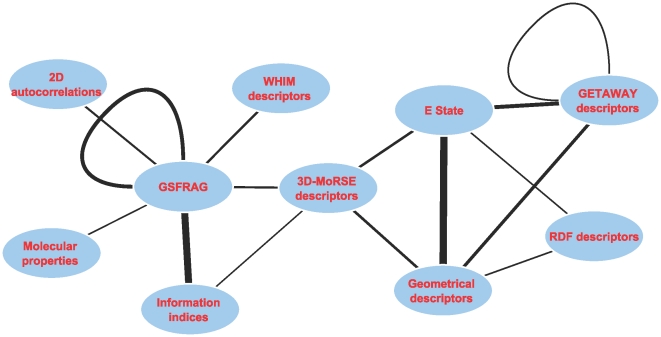
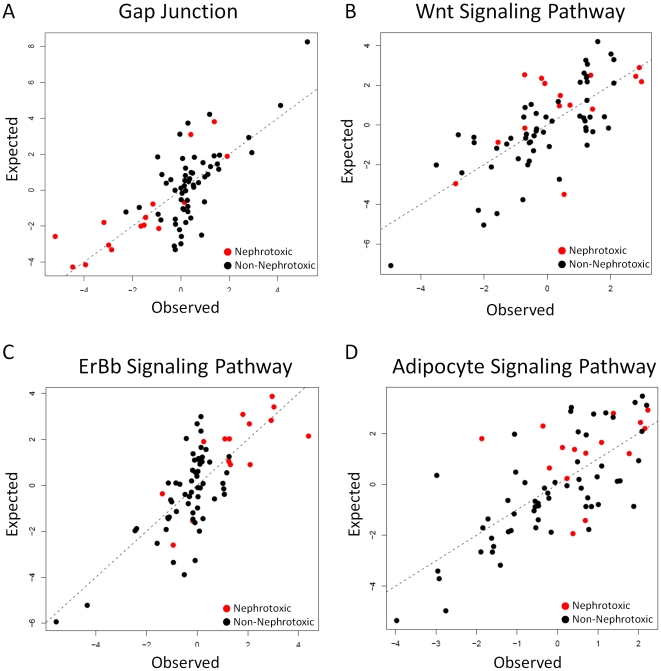
 values are 0.55 and 0.57 respectively. Wnt Signaling Pathway and Adipocyte Signaling Pathway contain features belonging to GSFRAG, Information indices, Edge adjacency indices and 3D-MoRSE descriptors. The
  values are 0.52 and 0.51 respectively. Note that models containing a feature from E-State indices and RDF descriptors better separate nephrotoxic and non-nephrotoxic samples.
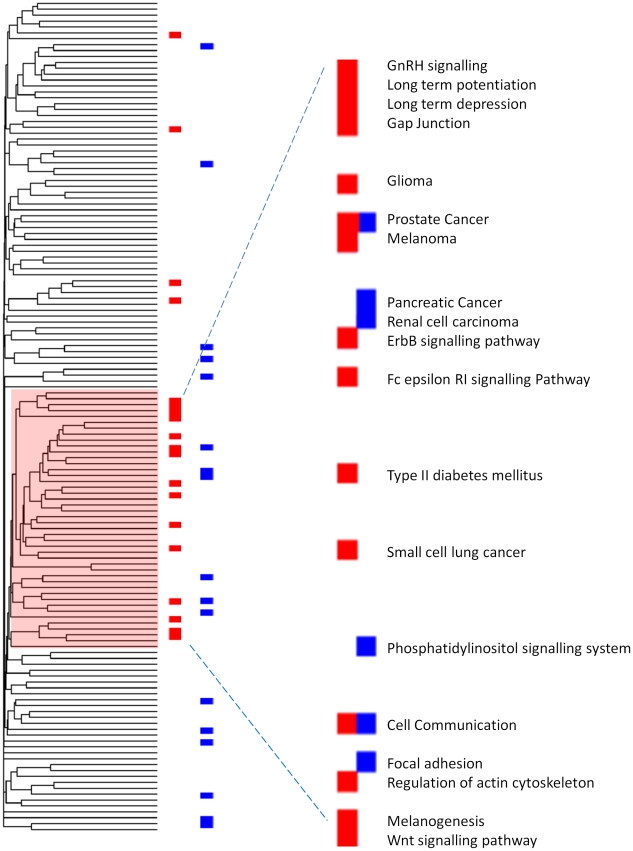
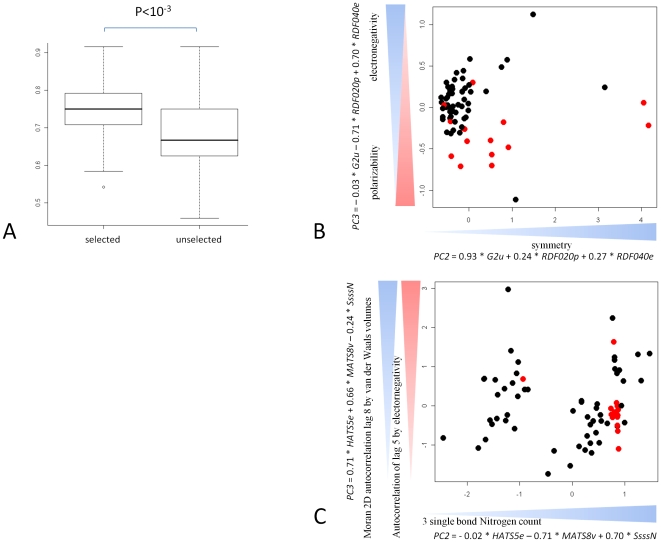
 ). Panels B and C show the PCA representation of the samples using the 3 most represented features in the model populations. The information for the best separation in both instances is present in PC2 and PC3. The equations for panel B show that a high increase in symmetry and high polarizability and low electronegativity is predictive of toxicity. In the case of the unselected features panel C toxic chemicals do cluster together but are specific to containing a nitrogen with a triple single bond and a low autocorrelation.
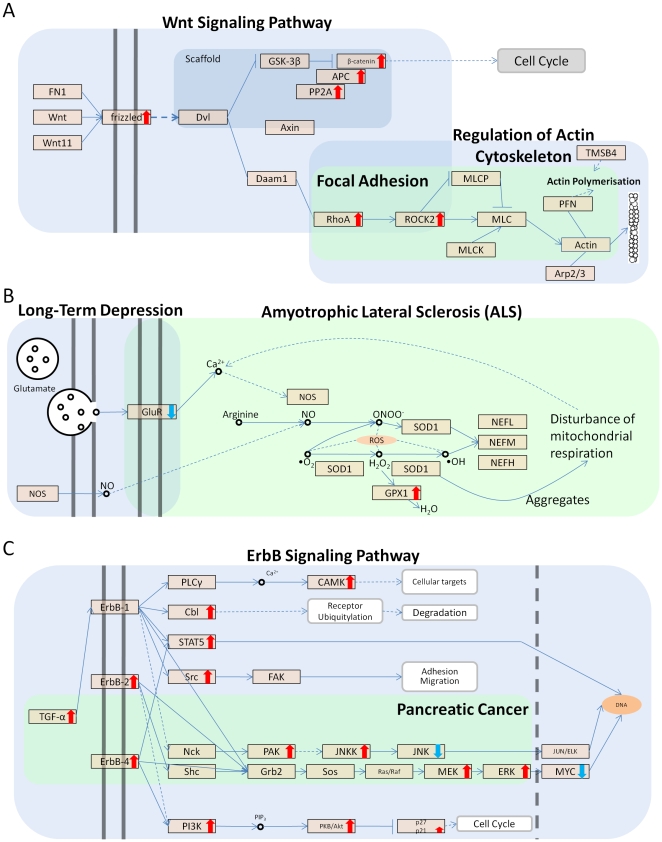
Similar articles
-
Impact of computational structure-based predictive toxicology in drug discovery.Comb Chem High Throughput Screen. 2011 Jun 1;14(5):417-26. doi: 10.2174/138620711795508395. Comb Chem High Throughput Screen. 2011. PMID: 21470184 Review.
-
Systems Toxicology: Systematic Approach to Predict Toxicity.Curr Pharm Des. 2016;22(46):6911-6917. doi: 10.2174/1381612822666161003115629. Curr Pharm Des. 2016. PMID: 27697024 Review.
-
Grouping 34 Chemicals Based on Mode of Action Using Connectivity Mapping.Toxicol Sci. 2016 Jun;151(2):447-61. doi: 10.1093/toxsci/kfw058. Epub 2016 Mar 29. Toxicol Sci. 2016. PMID: 27026708
-
Troubleshooting computational methods in drug discovery.J Pharmacol Toxicol Methods. 2010 Mar-Apr;61(2):67-75. doi: 10.1016/j.vascn.2010.02.005. Epub 2010 Feb 20. J Pharmacol Toxicol Methods. 2010. PMID: 20176118 Review.
-
Two-dimensional (2D) in silico models for absorption, distribution, metabolism, excretion and toxicity (ADME/T) in drug discovery.Curr Top Med Chem. 2010;10(1):116-26. doi: 10.2174/156802610790232224. Curr Top Med Chem. 2010. PMID: 19929825 Review.
Cited by
-
Pathway level metabolomics analysis identifies carbon metabolism as a key factor of incident hypertension in the Estonian Biobank.Sci Rep. 2025 Mar 12;15(1):8470. doi: 10.1038/s41598-025-92840-w. Sci Rep. 2025. PMID: 40069276 Free PMC article.
-
The common ground of genomics and systems biology.BMC Syst Biol. 2014;8 Suppl 2(Suppl 2):S1. doi: 10.1186/1752-0509-8-S2-S1. Epub 2014 Mar 13. BMC Syst Biol. 2014. PMID: 25033072 Free PMC article. Review.
-
Pathway network inference from gene expression data.BMC Syst Biol. 2014;8 Suppl 2(Suppl 2):S7. doi: 10.1186/1752-0509-8-S2-S7. Epub 2014 Mar 13. BMC Syst Biol. 2014. PMID: 25032889 Free PMC article.
-
Integrative network-based approach identifies central genetic and transcriptomic elements in triple-negative breast cancer.Funct Integr Genomics. 2018 Mar;18(2):113-124. doi: 10.1007/s10142-017-0579-3. Epub 2017 Dec 19. Funct Integr Genomics. 2018. PMID: 29260344
-
Machine Learning for Toxicity Prediction Using Chemical Structures: Pillars for Success in the Real World.Chem Res Toxicol. 2025 May 19;38(5):759-807. doi: 10.1021/acs.chemrestox.5c00033. Epub 2025 May 2. Chem Res Toxicol. 2025. PMID: 40314361 Free PMC article. Review.
References
-
- Mayr L, Bojanic D. Novel trends in high-throughput screening. Current Opinion in Pharmacology. 2009;9:580–588. - PubMed
-
- Vedani A, Dobler M, Lill M. The challenge of predicting drug toxicity in silico. Basic and Clinical Pharmacology and Toxicology. 2006;99:195. - PubMed
-
- Merlot C. Computational toxicology-a tool for early safety evaluation. Drug Discovery Today. 2009;15:16–22. - PubMed
-
- Vayer P, Arrault A, Lesur B, Bertrand M, Walther B. Chemoinformatics and virtual screening of molecules for therapeutic use. Médecine Sciences: M/S. 2009;25:871. - PubMed
-
- Conesa A, Bro R, García-García F, Prats J, Götz S, et al. Direct functional assessment of the composite phenotype through multivariate projection strategies. Genomics. 2008;92:373–383. - PubMed
Publication types
MeSH terms
Substances
Grants and funding
LinkOut - more resources
Full Text Sources
Medical
