. 2010 Aug 25;5(8):e12403.
doi: 10.1371/journal.pone.0012403.

Mutational characterization of the bile acid receptor TGR5 in primary sclerosing cholangitis

Affiliations

Mutational characterization of the bile acid receptor TGR5 in primary sclerosing cholangitis

Johannes R Hov et al. PLoS One. .

Abstract

Background: TGR5, the G protein-coupled bile acid receptor 1 (GPBAR1), has been linked to inflammatory pathways as well as bile homeostasis, and could therefore be involved in primary sclerosing cholangitis (PSC) a chronic inflammatory bile duct disease. We aimed to extensively investigate TGR5 sequence variation in PSC, as well as functionally characterize detected variants.

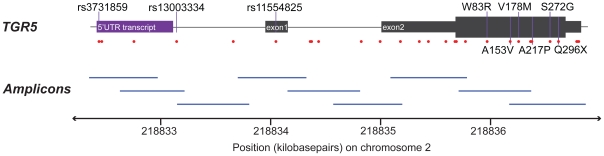
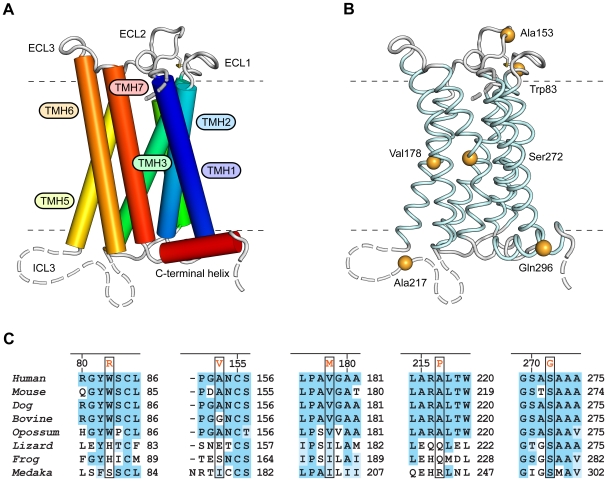
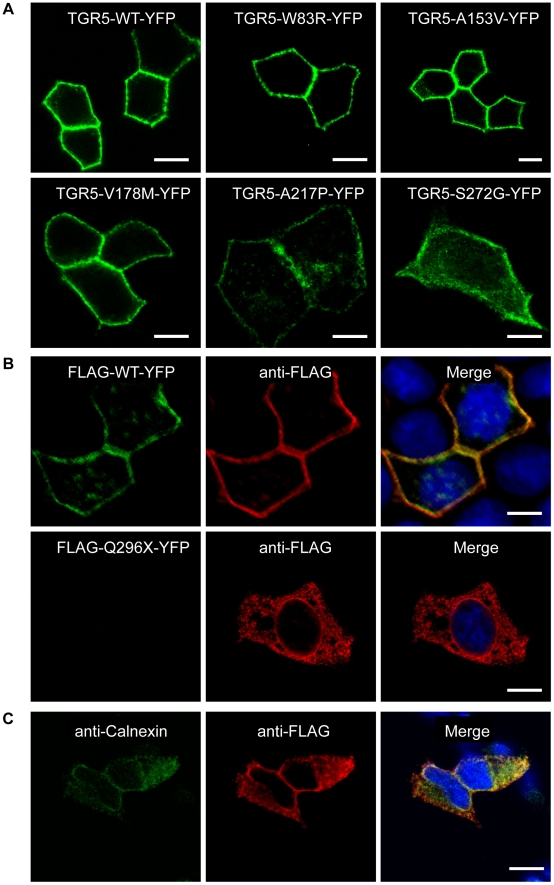
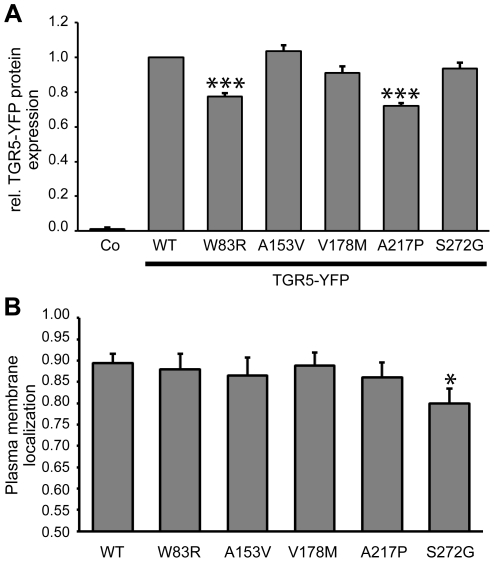
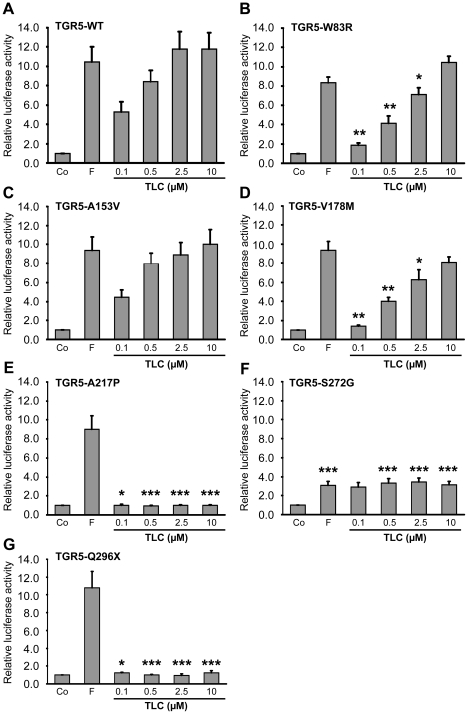
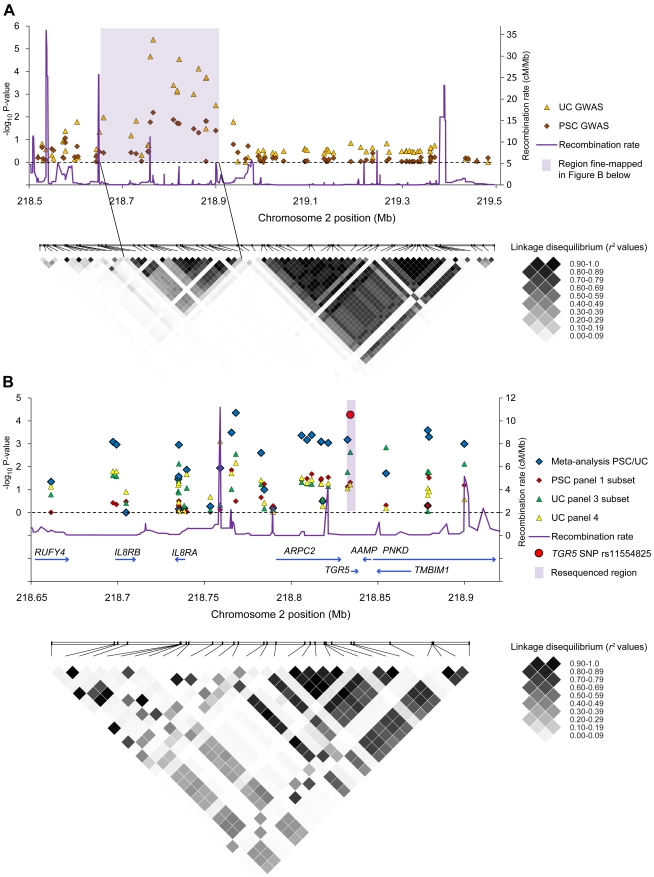
Methodology/principal findings: Complete resequencing of TGR5 was performed in 267 PSC patients and 274 healthy controls. Six nonsynonymous mutations were identified in addition to 16 other novel single-nucleotide polymorphisms. To investigate the impact from the nonsynonymous variants on TGR5, we created a receptor model, and introduced mutated TGR5 constructs into human epithelial cell lines. By using confocal microscopy, flow cytometry and a cAMP-sensitive luciferase assay, five of the nonsynonymous mutations (W83R, V178M, A217P, S272G and Q296X) were found to reduce or abolish TGR5 function. Fine-mapping of the previously reported PSC and UC associated locus at chromosome 2q35 in large patient panels revealed an overall association between the TGR5 single-nucleotide polymorphism rs11554825 and PSC (odds ratio = 1.14, 95% confidence interval: 1.03-1.26, p = 0.010) and UC (odds ratio = 1.19, 95% confidence interval 1.11-1.27, p = 8.5 x 10(-7)), but strong linkage disequilibrium precluded demarcation of TGR5 from neighboring genes.

Conclusions/significance: Resequencing of TGR5 along with functional investigations of novel variants provided unique insight into an important candidate gene for several inflammatory and metabolic conditions. While significant TGR5 associations were detected in both UC and PSC, further studies are needed to conclusively define the role of TGR5 variation in these diseases.


Conflict of interest statement

Competing Interests: The authors have declared that no competing interests exist.

Figures

Figure 1
Figure 1. Resequencing of TGR5.
The sequenced region of TGR5, covering chromosome 2 positions 218,832,394–218,836,917 (NCBI build 36), which includes two exons and the 5′untranslated region (5′UTR), where an alternative transcript has been reported. The coding part of TGR5 is entirely in exon 2 (thick section). Identified single-nucleotide polymorphisms (SNPs, Table 2) are represented by red dots, and the common SNPs and nonsynonymous mutations are named. The nine amplicons used for sequencing is illustrated below, covering a total of 4524 basepairs non-overlapping sequence with an average amplicon overlap of 174 basepairs.
Figure 2
Figure 2. Structure and residue conservation for the family A type G-protein-coupled receptor TGR5.
Panel A shows the 3D structure of TGR5 as determined by comparative modeling. The receptor comprises seven transmembrane helices (TMH1-7), three extracellular loops (ECL1-3), contributing to ligand binding, and three intracellular loops (ICL1-3) involved in mediating the signal to downstream signaling molecules. ICL3 and the N- and C-terminal segments are structurally flexible and disordered (broken lines). Panel B shows the location of the six residues found to be mutated in PSC patients and healthy controls. Evolutionary conservation in sequence segments containing the residues found to be mutated is shown in Panel C for a number of mammalian (Homo sapiens, Mus musculus, Canis familiaris, Bos taurus, and Monodelphis domestica) and other vertebrate species (Anolis carolinensis, Xenopus tropicalis, and Oryzias latipes).
Figure 3
Figure 3. Localization of TGR5 by confocal microscopy.
In Panel A, polarized MDCK cells were transiently transfected with the different TGR5-YFP variants including wild-type (TGR5-WT-YFP). All variants except TGR5-Q296X-YFP reached the plasma membrane, however TGR5-A217P-YFP and TGR5-S272G-YFP were also present in some intracellular vesicles. In Panel B, MDCK cells were transiently transfected with FLAG-TGR5-YFP constructs (wild-type and the Q296X mutant). The FLAG-tag was made visible using an anti-FLAG-M2 antibody (in red) and the yellow coloring in the overlay image demonstrates that the FLAG antibody completely binds to the FLAG-TGR5-YFP wild-type protein both in the plasma membrane as well as in intracellular vesicles (upper row). Introduction of the mutation Q296X leads to a premature stop codon and results in a truncated FLAG-Q296X-YFP protein as demonstrated by the absence of the YFP-fluorescence, but by using the anti-FLAG antibody the truncated protein could be detected (lower row). In Panel C, HEK293 cells were transiently transfected with the Q296X mutant of FLAG-TGR5-YFP (for the remaining variants, see Figure S5). The truncated protein, stained with the anti-FLAG antibody, was almost completely retained in the endoplasmatic reticulum, as demonstrated by the colocalization with the endoplasmatic reticulum marker calnexin. Nuclei were stained with Hoechst. Bars = 10 µm.
Figure 4
Figure 4. Quantification of expression and localization of TGR5 variants.
Panel A shows TGR5-YFP protein expression measured by flow cytometry. Mean fluorescence intensity per transfected cell was calculated, and expression of TGR5-WT-YFP (wild-type) was set to 1.0. Untransfected cells (Co) served as controls. The protein expression levels of the W83R (0.77±0.02, n = 6) and A217P (0.72±0.02, n = 6) variants were reduced. Results are shown as mean±standard error of the mean. ***Indicates significant difference (p<0.001) compared with wild-type. Panel B shows membrane localization of FLAG-TGR5-YFP variants as determined by flow cytometry. The N-terminal FLAG-tag is localized extracellularly and can be labeled with antibodies only when TGR5 is localized in the plasma membrane. The amount of receptor within the plasma membrane was determined by dividing the amount of FLAG-labeled TGR5 by the total amount of TGR5, as determined by YFP-fluorescence. In HEK293-cells 89±2% (n = 7) of wild-type was located in the plasma membrane, which was similar to W83R, A153V, V178M and A217P. The S272G variant showed significantly reduced plasma membrane localization compared with wild-type (80±3%, n = 7). Results are shown as mean±standard error of the mean. *Indicates significant difference (p<0.05) as compared with wild-type.
Figure 5
Figure 5. Activation of TGR5 variants by the bile acid taurolithocholic acid (TLC).
HEK293 cells were cotransfected with TGR5 and a reporter gene containing five cAMP responsive elements in front of the luciferase gene. Luciferase activity served as a measure of the rise in intracellular cAMP following activation of TGR5. Forskolin (F, 10 µM) stimulated cAMP production independently of TGR5 and served as positive control. Results are expressed as mean±standard error of the mean. *Indicates significant difference (p<0.05) as compared with TGR5 wild-type (TGR5-WT). **p<0.01. ***p<0.001. In Panel A, activation of TGR5 wild-type (TGR5-WT) by TLC led to significant rises in luciferase activity already at a concentration of 0.1 µM (n = 14). Panel B and D show significantly reduced responses from TGR5-W83R (n = 4) and TGR5-V178M (n = 9) to 0.1, 0.5 and 2.5 µM TLC compared with TGR5-WT, while the responses to forskolin and 10 µM TLC were unaffected. The A153V variant did not affect receptor activity (Panel C, n = 12).The A217P (Panel E, n = 6) and Q296X (Panel G, n = 7) variants completely lost responsiveness to TLC. Panel F shows the S272G variant, which exhibited suppressed activation of luciferase by both forskolin and TLC at concentrations of 0.5, 2.5 and 10 µM (n = 11).
Figure 6
Figure 6. Genetic analyses at chromosome 2q35.
Panel A shows results from the association analysis (negative log10-transformed p-values plotted on the vertical axis) of individual single-nucleotide polymorphisms (SNPs) at chromosome 2q35 in data sets from previous genome-wide association studies (GWAS) in primary sclerosing cholangitis (285 patients and 298 healthy controls) and ulcerative colitis (1167 patients and 777 healthy controls) , . A linkage disequilibrium (LD) plot below shows pairwise LD (r 2) between the SNPs, calculated in the healthy controls, where increasing r 2 values correspond to increasing LD. The shaded area covers the peak of associated SNPs corresponding to a region with strong LD. Panel B shows fine-mapping of the shaded region in Panel A performed in three patient panels (details of the analysis are shown in Results S1). The individuals in the PSC panel 1 subset (285 patients and 296 healthy controls) completely overlapped with the PSC GWAS in panel A, while the individuals in the UC panel 3 subset (521 patients, 1096 controls) and UC panel 4 (361 patients, 1104 controls) were independent from the UC GWAS in panel A. In addition to association analyses in the individual study panels, a PSC-UC meta-analysis of all fine-mapped patients (n = 1167) and healthy controls (n = 2496) was performed. The fine-mapped region was characterized by strong LD, as shown in the lower plot, but a recombination hot-spot was present between the IL8RA and IL8RB loci and the TGR5 (GPBAR1) locus and neighboring genes (ARPC2-TGR5-AAMP-TMBIM1-PNKD). The meta-analysis p-value of the TGR5 exon 1 SNP rs11554825 is highlighted in red, while the shaded area in Panel B shows the resequenced region covering TGR5.

References

    1. Maruyama T, Miyamoto Y, Nakamura T, Tamai Y, Okada H, et al. Identification of membrane-type receptor for bile acids (M-BAR). Biochem Biophys Res Commun. 2002;298:714–719. - PubMed
    1. Kawamata Y, Fujii R, Hosoya M, Harada M, Yoshida H, et al. A G protein-coupled receptor responsive to bile acids. J Biol Chem. 2003;278:9435–9440. - PubMed
    1. Keitel V, Donner M, Winandy S, Kubitz R, Haussinger D. Expression and function of the bile acid receptor TGR5 in Kupffer cells. Biochem Biophys Res Commun. 2008;372:78–84. - PubMed
    1. Maruyama T, Tanaka K, Suzuki J, Miyoshi H, Harada N, et al. Targeted disruption of G protein-coupled bile acid receptor 1 (Gpbar1/M-Bar) in mice. J Endocrinol. 2006;191:197–205. - PubMed
    1. Vassileva G, Golovko A, Markowitz L, Abbondanzo SJ, Zeng M, et al. Targeted deletion of Gpbar1 protects mice from cholesterol gallstone formation. Biochem J. 2006;398:423–430. - PMC - PubMed

Publication types

MeSH terms

Substances