. 2010 Aug 25;5(8):e12383.
doi: 10.1371/journal.pone.0012383.

Modeling core metabolism in cancer cells: surveying the topology underlying the Warburg effect

Affiliations

Modeling core metabolism in cancer cells: surveying the topology underlying the Warburg effect

Osbaldo Resendis-Antonio et al. PLoS One. .

Abstract

Background: Alterations on glucose consumption and biosynthetic activity of amino acids, lipids and nucleotides are metabolic changes for sustaining cell proliferation in cancer cells. Irrevocable evidence of this fact is the Warburg effect which establishes that cancer cells prefers glycolysis over oxidative phosphorylation to generate ATP. Regulatory action over metabolic enzymes has opened a new window for designing more effective anti-cancer treatments. This enterprise is not trivial and the development of computational models that contribute to identifying potential enzymes for breaking the robustness of cancer cells is a priority.

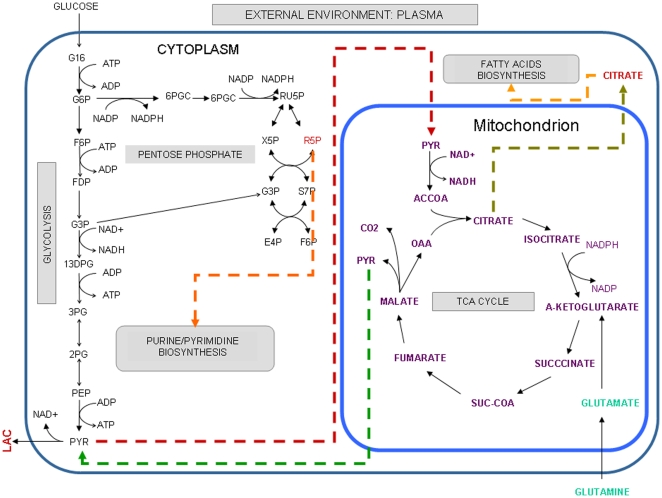
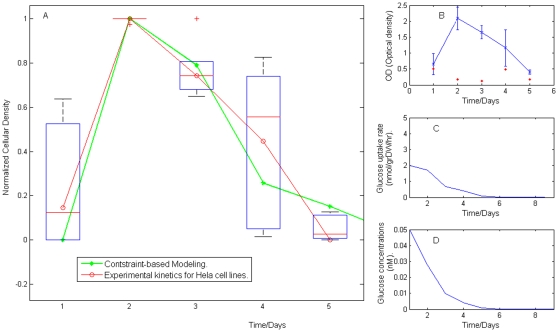
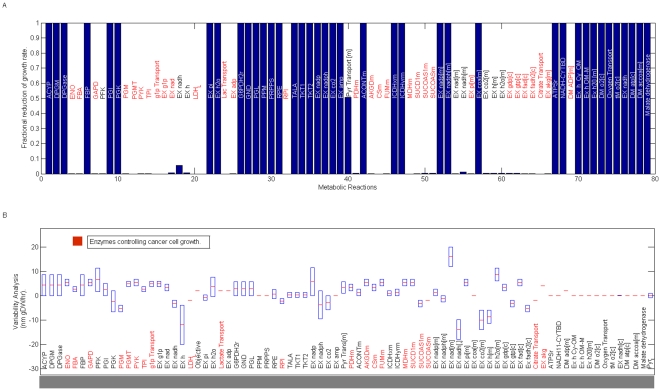
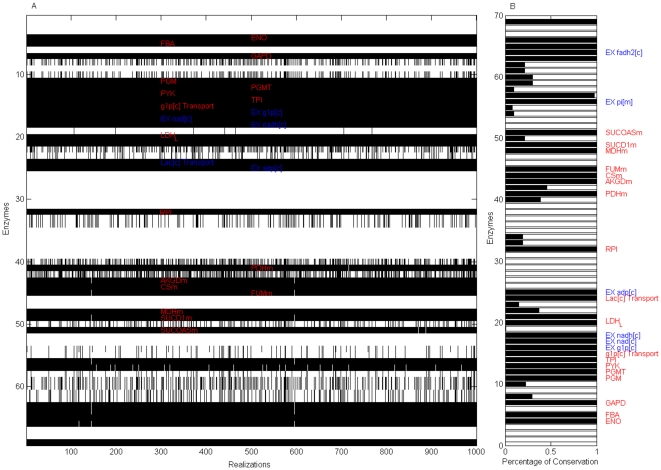
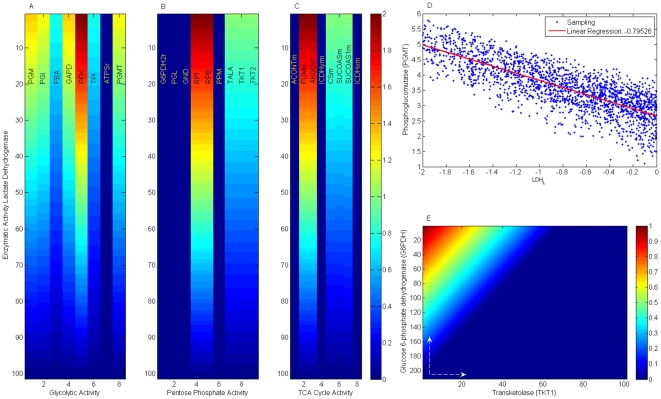
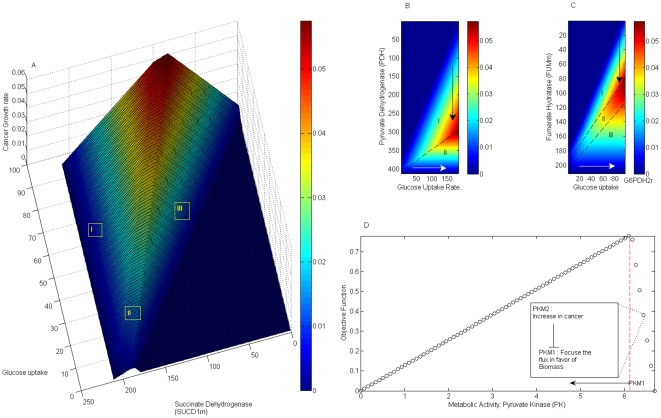
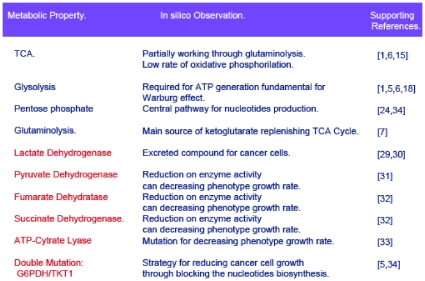
Methodology/principal findings: This work presents a constraint-base modeling of the most experimentally studied metabolic pathways supporting cancer cells: glycolysis, TCA cycle, pentose phosphate, glutaminolysis and oxidative phosphorylation. To evaluate its predictive capacities, a growth kinetics study for Hela cell lines was accomplished and qualitatively compared with in silico predictions. Furthermore, based on pure computational criteria, we concluded that a set of enzymes (such as lactate dehydrogenase and pyruvate dehydrogenase) perform a pivotal role in cancer cell growth, findings supported by an experimental counterpart.

Conclusions/significance: Alterations on metabolic activity are crucial to initiate and sustain cancer phenotype. In this work, we analyzed the phenotype capacities emerged from a constructed metabolic network conformed by the most experimentally studied pathways sustaining cancer cell growth. Remarkably, in silico model was able to resemble the physiological conditions in cancer cells and successfully identified some enzymes currently studied by its therapeutic effect. Overall, we supplied evidence that constraint-based modeling constitutes a promising computational platform to: 1) integrate high throughput technology and establish a crosstalk between experimental validation and in silico prediction in cancer cell phenotype; 2) explore the fundamental metabolic mechanism that confers robustness in cancer; and 3) suggest new metabolic targets for anticancer treatments. All these issues being central to explore cancer cell metabolism from a systems biology perspective.


Conflict of interest statement

Competing Interests: The authors have declared that no competing interests exist.

Figures

Figure 1
Figure 1. Metabolic pathways with a significant role in cancer cells.
As a result of a bibliography search, we have selected those metabolic pathways that potentially can constitute a metabolic core on most cancer cells. Orange, red and green dashed lines indicate metabolites that participate in other biosynthetic pathways, metabolites that can be transported from cytoplasm to mitochondrion and metabolites that can be transported from mitochondrion to cytoplasm, respectively. Compartment information has been denoted by external environment [e], cytoplasm [c] and mitochondria [m]. The set of reactions that integrates this reconstruction are listed in Table S1.
Figure 2
Figure 2. Temporal profile of kinetic cell growth.
(A) Comparative analysis between the growth rate obtained experimentally and in silico. (B) Average and standard deviation obtained in the kinetics measurements for Hela cell lines. As described in methods, growth rate was monitored every 24 hours for five days, and six replicates were obtained for each absorbance measurement. Statistical properties characterizing the kinetic growth on Hela cell lines are shown in Figure 2(B), while the temporal behavior of glucose uptake rate and external concentration predicted by in silico procedures are depicted in (C) and (D), respectively. Coefficients of variation obtained at each measurement are reported by the red points in (B).
Figure 3
Figure 3. Flux Variability and Enzyme essentiality on metabolic reactions.
To identify those reactions that could have a pivotal role in cancer growth rate, flux variability and enzyme essentiality analysis were accomplished over all the reactions included in the reconstruction. In panel (A), the metabolic reactions whose deletion produces a significant reduction on growth rate are highlighted in red. Those reactions that ensure a low variability and high essentiality constitute 27% of the complete metabolic reconstruction and these appear in red in panel (B). Exchange and sink reactions were excluded from this analysis. Abbreviation code: Enolase (ENO), glyceraldehyde-3-phosphate dehydrogenase(GAPD), phosphoglucomutase (PGMT), pyruvate kinase (PYK), triose-phosphate isomerase (TPI), lactate dehydrogenase (LDH), ribose-5-phosphate isomerase (RPI), pyruvate dehydrogenase (PDHm), 2-oxoglutarate dehydrogenase (AKGDm), cytrate synthase (CSm), Fumarate hydratase (FUMm), malate dehydrogenase (MDHm), succinate dehydrogenase (SUCD1m), succinyl-CoA synthetase (SUCOAS).
Figure 4
Figure 4. Enzymes with high essentiality and low variability that are robust to the ratio of objective function's components.
Reactions with high essentiality and low variability were identified through a set of 1000 objective functions with nonequivalent ratios among function components. As panel (A) shows, reactions obeying both criteria (red on black regions) were plotted over the 1000 realizations. In each realization, those enzymes that obey the in silico criteria were denoted in black; all others in white. The percentage of times reactions obeyed the computational criteria are depicted in panel (B). Robust enzymes relevant to this study (excluding transporters, exchange and demand reactions) were labeled in red. EX, DM and Sink denote exchange, demand and sink reactions in the cytoplasm [c] and mitochondria [m] compartments.
Figure 5
Figure 5. Lactate dehydrogenase and its influence on central pathways.
Lactate dehydrogenase (LDH) has been suggested as a pivotal metabolic control on cancer cell growth with a significant role in the Warburg effect. Panels (A), (B) and (C) show the effects that variations of LDH activity have on some enzymes participating in glycolysis, TCA cycle and pentose phosphate, respectively. Metabolic activity of LDH increases from bottom to top. Panel (D) shows the correlation between flux activity of LDH and phosphoglucomutase (PGMT) obtained through sampling the null space of the stoichiometric matrix. Phenotype phase plane for glucose-6-phosphate dehydrogenase (G6PDH) and transketolase (TKT1), enzymes quantifying the activity of the oxidative and non-oxidative branches of pentose phosphate, is depicted in panel (E). White arrows indicate the direction at which the metabolic flux increases.
Figure 6
Figure 6. Phenotype phase plane for glycolytic and TCA cycle enzymes.
Panel (A) is a three-dimensional representation of how metabolic activity of succinate dehydrogenase and glucose uptake rate influence growth. As Panels (B) and (C) show, in silico modeling leads us to identify some regions where variations on pyruvate dehydrogenase and fumarate hydratase, both associated with tumor suppressor activity, can result in different phenotypes. White lines indicate the direction at which the metabolic fluxes increase; black lines, the direction at which they decrease. The potential effect that pyruvate kinase activity can produce on cancer cell growth is depicted in (D). In panel (D) objective function components were selected as follows: cATP = 12.47, cLactate = 0.13, cNADPH = 0.93, cR5P = 0.6, cNAD = 0.89, cOAA = 0.75, cATP[m] = 17.09 and cCitrate = 0.55. The threshold flux activity is denoted by a red line.
Figure 7
Figure 7. Physiological assessment of in silico interpretations.
A proper assessment of in silico results is required to ensure proper reconstruction. Ten proofs were used here to evaluate the physiological consistency of the results from constraint-based modeling. In sequential order, columns indicate the metabolic property computationally analyzed, in silico predictions and its consistency with some representative references. The blue text in column 1 represents metabolic pathways, while red lines indicate the effects that enzyme mutation has on cancer cell growth.

References

    1. Weinberg RA. The biology of Cancer. Garland Sciences, Taylor & Francis Group, LLC; 2007.
    1. Hsu PP, Sabatini DM. Cancer cell metabolism: Warburg and beyond. Cell. 2008;134:703–707. - PubMed
    1. Shaw RJ. Glucose metabolism and cancer. Curr Opin Cell Biol. 2006;18:598–608. - PubMed
    1. Kreeger PK, Lauffenburger DA. Cancer Systems Biology: A Network Modeling Perspective. Carcinogenesis; 2009. - PMC - PubMed
    1. Wolkenhauer O, Auffray C, Baltrusch S, Bluthgen N, Byrne H, et al. Systems biologists seek fuller integration of systems biology approaches in new cancer research programs. Cancer Res. 70:12–13. - PMC - PubMed

Publication types