

Memory B cells from a subset of treatment-naïve relapsing-remitting multiple sclerosis patients elicit CD4(+) T-cell proliferation and IFN-γ production in response to myelin basic protein and myelin oligodendrocyte glycoprotein
- PMID: 20812237
- PMCID: PMC3072802
- DOI: 10.1002/eji.201040516
Memory B cells from a subset of treatment-naïve relapsing-remitting multiple sclerosis patients elicit CD4(+) T-cell proliferation and IFN-γ production in response to myelin basic protein and myelin oligodendrocyte glycoprotein
Abstract
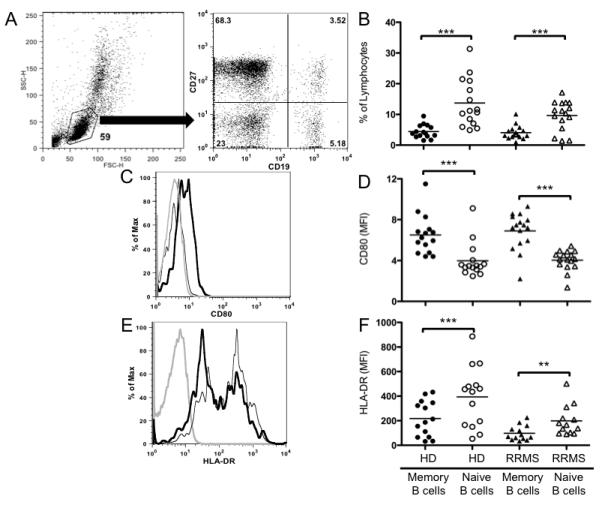
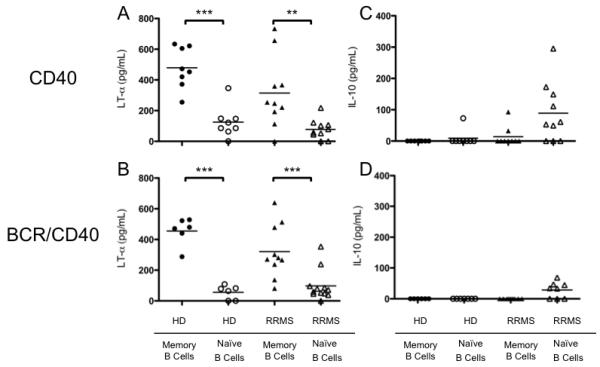
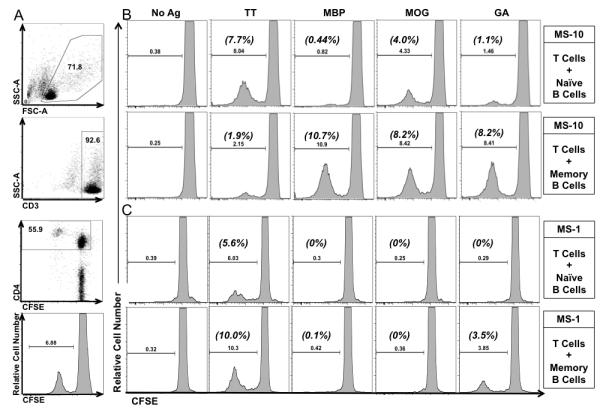
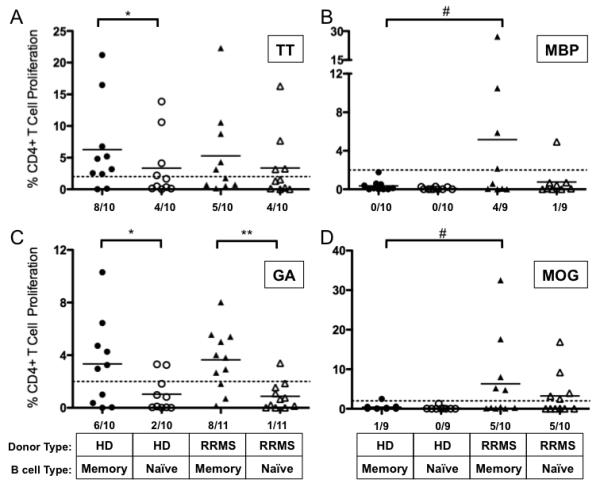
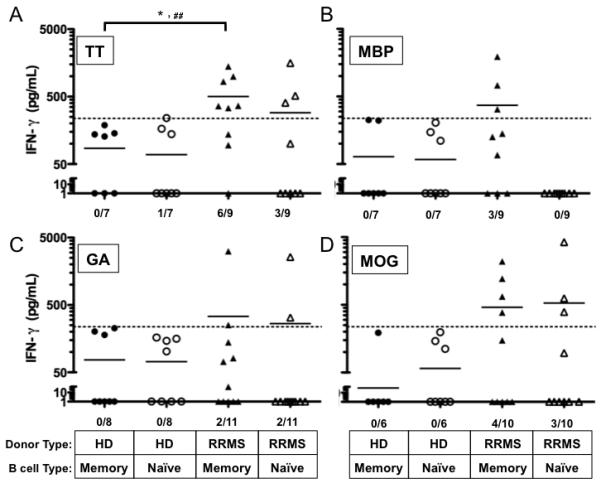
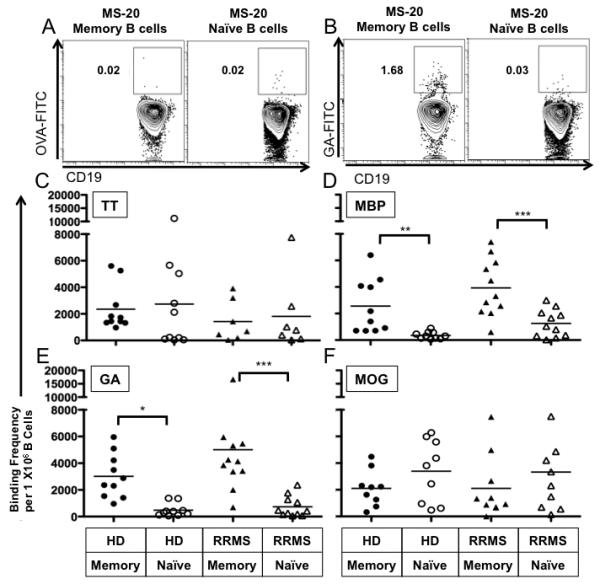
Recent evidence suggests that B- and T-cell interactions may be paramount in relapsing-remitting MS (RRMS) disease pathogenesis. We hypothesized that memory B-cell pools from RRMS patients may specifically harbor a subset of potent neuro-APC that support neuro-Ag reactive T-cell proliferation and cytokine secretion. To test this hypothesis, we compared CD80 and HLA-DR expression, IL-10 and lymphotoxin-α secretion, neuro-Ag binding capacity, and neuro-Ag presentation by memory B cells from RRMS patients to naïve B cells from RRMS patients and to memory and naïve B cells from healthy donors (HD). We identified memory B cells from some RRMS patients that elicited CD4(+) T-cell proliferation and IFN-γ secretion in response to myelin basic protein and myelin oligodendrocyte glycoprotein. Notwithstanding the fact that the phenotypic parameters that promote efficient Ag presentation were observed to be similar between RRMS and HD memory B cells, a corresponding capability to elicit CD4(+) T-cell proliferation in response to myelin basic protein and myelin oligodendrocyte glycoprotein was not observed in HD memory B cells. Our results demonstrate for the first time that the memory B-cell pool in RRMS harbors neuro-Ag specific B cells that can activate T cells.
Figures
Similar articles
-
Interferon-beta therapy reduces CD4+ and CD8+ T-cell reactivity in multiple sclerosis.Immunology. 2007 May;121(1):29-39. doi: 10.1111/j.1365-2567.2006.02518.x. Epub 2006 Dec 18. Immunology. 2007. PMID: 17239199 Free PMC article.
-
Specific proliferation towards myelin antigens in patients with multiple sclerosis during a relapse.Autoimmunity. 2002 Feb;35(1):45-50. doi: 10.1080/08916930290005927. Autoimmunity. 2002. PMID: 11908706
-
The T-cell pool is anergized in patients with multiple sclerosis in remission.Immunology. 2009 Jan;126(1):92-101. doi: 10.1111/j.1365-2567.2008.02881.x. Epub 2008 Jun 24. Immunology. 2009. PMID: 18624727 Free PMC article.
-
Myelin oligodendrocyte glycoprotein: a novel candidate autoantigen in multiple sclerosis.J Mol Med (Berl). 1997 Feb;75(2):77-88. doi: 10.1007/s001090050092. J Mol Med (Berl). 1997. PMID: 9083925 Review.
-
Increased in vitro induced CD4+ and CD8+ T cell IFN-gamma and CD4+ T cell IL-10 production in stable relapsing multiple sclerosis.Int J Neurosci. 1997 Aug;90(3-4):187-202. doi: 10.3109/00207459709000638. Int J Neurosci. 1997. PMID: 9352427 Review.
Cited by
-
Update on the autoimmune pathology of multiple sclerosis: B-cells as disease-drivers and therapeutic targets.Eur Neurol. 2015;73(3-4):238-246. doi: 10.1159/000377675. Epub 2015 Mar 25. Eur Neurol. 2015. PMID: 25824054 Free PMC article. Review.
-
B-Cell Therapies in Multiple Sclerosis.Cold Spring Harb Perspect Med. 2019 Feb 1;9(2):a032037. doi: 10.1101/cshperspect.a032037. Cold Spring Harb Perspect Med. 2019. PMID: 29358322 Free PMC article. Review.
-
Circulating immune cells in multiple sclerosis.Clin Exp Immunol. 2017 Feb;187(2):193-203. doi: 10.1111/cei.12878. Epub 2016 Nov 2. Clin Exp Immunol. 2017. PMID: 27689339 Free PMC article. Review.
-
Impact of Glatiramer Acetate on B Cell-Mediated Pathogenesis of Multiple Sclerosis.CNS Drugs. 2018 Nov;32(11):1039-1051. doi: 10.1007/s40263-018-0567-8. CNS Drugs. 2018. PMID: 30315499 Free PMC article. Review.
-
The effect of glatiramer acetate therapy on functional properties of B cells from patients with relapsing-remitting multiple sclerosis.JAMA Neurol. 2014 Nov;71(11):1421-8. doi: 10.1001/jamaneurol.2014.1472. JAMA Neurol. 2014. PMID: 25264704 Free PMC article. Clinical Trial.
References
-
- Hauser SL, Waubant E, Arnold DL, Vollmer T, Antel J, Fox RJ, Bar-Or A, Panzara M, Sarkar N, Agarwal S, Langer-Gould A, Smith CH. B-cell depletion with rituximab in relapsing-remitting multiple sclerosis. N Engl J Med. 2008;358:676–688. - PubMed
-
- Bar-Or A, Fawaz L, Fan B, Darlington PJ, Rieger A, Ghorayeb C, Calabresi PA, Waubant E, Hauser SL, Zhang J, Smith CH. Abnormal B-cell cytokine responses a trigger of T-cell-mediated disease in MS? Ann Neurol. 67:452–461. - PubMed
-
- Stuve O, Leussink VI, Frohlich R, Hemmer B, Hartung HP, Menge T, Kieseier BC. Long-term B-lymphocyte depletion with rituximab in patients with relapsing-remitting multiple sclerosis. Arch Neurol. 2009;66:259–261. - PubMed
-
- Krumbholz M, Meinl I, Kumpfel T, Hohlfeld R, Meinl E. Natalizumab disproportionately increases circulating pre-B and B cells in multiple sclerosis. Neurology. 2008;71:1350–1354. - PubMed
-
- Gray D, Gray M, Barr T. Innate responses of B cells. Eur J Immunol. 2007;37:3304–3310. - PubMed
Publication types
MeSH terms
Substances
Grants and funding
LinkOut - more resources
Full Text Sources
Research Materials
